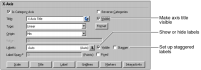
Chart types other than pie and meter can have
x-axis or
y-axis titles. To add and format an
x-axis title, navigate to the X-Axis section of Format Chart. Select Visible, shown in
Figure 22‑76. Then, type text in Title. To modify the position, outline, padding, or font style of the axis title, choose Title. Toggle between the
x‑axis or the
y-axis to make title changes to one or the other by navigating to X‑Axis or Y-Axis in the Chart Area.
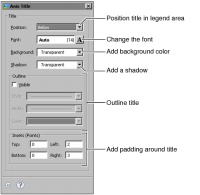
In Axis Title, shown in
Figure 22‑77, you can position the title above or below an
x-axis, or you can position the title to the left or right of a
y-axis. You can outline the title, and add padding around it using Insets. You can change the size and style of the font, and add a shadow or a background color.