The procedure for creating a gadget or map is the same as the procedure for creating a BIRT chart. To create a gadget or map, perform the following tasks:
Drag the map or gadget element from the palette and drop it in the report.
Choose a map or gadget type.
Specify the data to present.
Format the gadget or map.
The formatting options available to the gadgets are different from the formatting options available to BIRT charts. While many of the chart parts and formatting attributes are the same, a measurement gadget supports visual effects to parts of the gadget. A map enables you to highlight locations and values on the map.
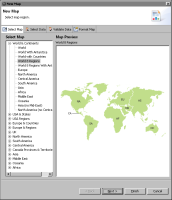
Figure 18‑3 shows an example of the Select Map page.