You can create a filter in any or all of the following places:
The data set
A report element, such as a table, list, chart, or cross tab
A group
The first opportunity to filter data in BIRT is on the data set level. Use this technique if only one report element uses the data set or if you want all report elements that use the data set to use the same set of rows.
Next, you can filter on a report element. Edit the report element filter properties to specify conditions for displaying only certain data rows. Use this technique if multiple tables, lists, and charts use the same data set, but you want each report element to display a different set of rows.
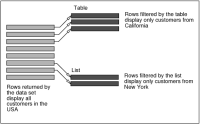
For example, consider a data set that returns data for all customers in the USA. You use this data set for two elements, such as a table and a list. Specify a different filter condition for each element to limit further the rows to display. The table element, for example, can filter the rows to display only customers from California. The list element can filter the rows to display only customers from New York. Figure 12‑5 illustrates this concept.
Figure 12‑5 Filters applied to a data set, a table, and a list
Finally, you can filter on a group of data. If grouping data in a table or list, you can edit the filter properties of each group. Filter at the group level if a table or list displays rows in groups and you want to display only certain groups. For example, a sales report groups orders by customer. Rather than showing data for all customers, you can specify a filter to display only customers that have order totals above a certain amount, or specify a filter to display only the top three customers.
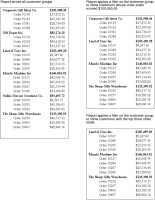
Figure 12‑6 compares three reports that use the same data set but different group filters. The first report shows all customer groups. The second report uses a filter at the customer group level to show only customers whose order totals exceed $100,000.00. The third report uses a filter at the customer group level to show the top three customers with the highest order totals.
Figure 12‑6 Three reports that apply filters on the group level to display different results from the same data set
You can specify filter conditions at all three levels if necessary. Filtering at each level serves a different purpose, can yield different results, and can have different rules. Use the following guidelines to decide where to filter data for a report:
When filtering at the data set level, BIRT filters rows that are retrieved from the data source.
When filtering at the report element level, BIRT filters rows that are returned by the data set that is bound to the report element.
When filtering at the group level, BIRT filters only rows in that particular group. In the reports shown in Figure 12‑6, you can filter on customer names and order totals only. You cannot filter on order number because that data is in a different group. Typically, a filter at the group level uses an aggregation.
Filters that use aggregate data can be specified only at the group level. The second report shown in Figure 12‑6 uses the following filter condition:
row["Customer_Total"] Greater than 100000
The third report uses the following filter condition:
row["Customer_Total"] Top n 3
In these filter conditions, row["Customer_Total"] refers to a column binding that calculates customer order totals, using the SUM aggregate function. If you use aggregate data in a filter at the data set or report element level, BIRT Report Designer displays an error message.
Some filter conditions provide the same results whether they are applied at the data set, report element, or group level. In the reports shown in Figure 12‑6, to display only customers whose names start with M or a later letter, you can specify the following filter condition at the data set, table, or group level, and the reports display the same data: