When you first create a report and preview the data, the report displays the data in the order in which the data source returns it. The order varies based on how data was entered in the data source and how you joined tables in the query.
In most cases, you will want to change the order in which data appears in a report. A customer phone list, for example, is easier to use if it is in alphabetical order. A sales report is more useful if it presents sales figures from highest to lowest, or the reverse, depending on whether the focus is on top or low performers.
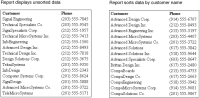
Figure 9‑1 Reports showing unsorted and sorted data
The report on the left displays customer names in the order in which the data set returns them. The customer names appear in a seemingly random order. The report on the right displays the customer names sorted in alphabetical order.
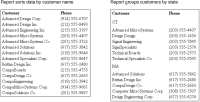
Now, compare the reports in Figure 9‑2. The report on the left sorts the data alphabetically by customer name. The report on the right also sorts the data alphabetically by customer name, but adds an additional sort criterion, by state. This report first groups the data by state, then within each state, the report sorts data by customer name.
As you can see from the examples, sorting and grouping are two essential ways to organize data for more effective viewing and analysis.
Figure 9‑2 Reports showing two different sorting techniques