The procedure for creating an HTML5 chart is the same as the procedure for creating a BIRT chart. To create an HTML5 chart, perform the following tasks:
Drag the chart element from the palette and drop it in the report.
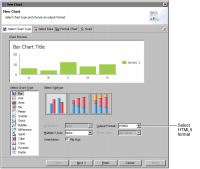
In the chart builder, choose a chart type, and set Output Format to HTML5, as shown in Figure 23‑1. This is the default format if you select a chart type supported by HTML5.
Figure 23‑1 Select Chart Type page showing selected HTML5 output format
Specify the data to present in the chart.
Format the chart.
This chapter describes the features that are unique to HTML5 charts, for example, scripting with the Highcharts API and designing chart themes using JavaScript. For information about specifying data for a chart, see Displaying data in charts.