In addition to page-level security, iHub also supports data security, which controls user access to a particular set of data provided by a BIRT data object. For example, you can design a data object that returns one set of data rows for one group of dashboard or report users, and a different set for another group of users.
You can limit access to the following items in a data object:
A data set, its rows and columns, based on access control lists (ACL)
A cube, its measures, dimensions, dimension levels, and dimension members, based on access control lists (ACL)
Data model rows, based on data security rules (DSR) for columns and categories
iHub supports ACL-based data security on DATA files, but not on DATADESIGN files. After designing the data object, generate a data object store (a DATA file) and publish this file to an iHub volume.
Users can only see and use the data items to which they are granted access. The security rules apply to users designing a dashboard in Dashboards or a report in Report Studio, as well as, users running a dashboard or report.
Unlike page-level security, the concept of cascading, or inherited, ACLs does not apply to data security. A cube does not inherit the ACL specified for the data set that the cube uses. Similarly, a joined data set does not inherit ACLs specified for the underlying data sets.
DSRs are extensible and inheritable. iHub supports DSRs on both DATA and DATADESIGN files. For information about creating and using DRSs, see Provisioning Data.
Adding security to a data object
To implement security in a data object, perform the following tasks:
Identify the data items that require security.
Identify the users that can view each item. Obtain the security IDs, typically user groups, from the iHub volume administrator.
In the data object design (.datadesign), for each item that requires security, set the item’s Access Control List Expression property to the security ID or IDs to which to grant access to the item.
Adding security to a data set
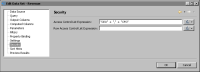
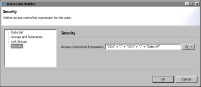
To apply security to a data set, select Security, then specify the security IDs in Access Control List Expression. Figure 33‑11 shows an example where the expression specified for the data set’s Access Control List Expression property is:
"CEO" + "," + "CFO"
Figure 33‑11 Data security applied to the data set
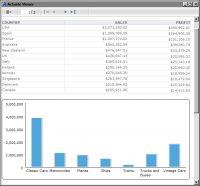
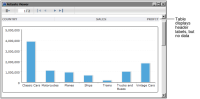
In the example, only users with the CEO or CFO user group can access the data set. For example, in a report that contains a table that uses the secured data set, only the CEO and CFO can view the data in the table, as shown in Figure 33‑12. Other users see an empty table, as shown in Figure 33‑13.
Figure 33‑12 Preview of the report for the CEO and CFO user groups
As Figure 33‑13 shows, the table does not display data from the secured data set, but the labels in the table’s header appear. To hide the entire table if there is no data, use the table’s Visibility property. Specify an expression, as shown in the following example, as the condition for hiding the table. In the expression, Row_Count is a column binding that uses the COUNT function to return the number of rows in the table.
row["Row_Count"] == null
Figure 33‑13 Preview of the report for user groups other than CEO or CFO
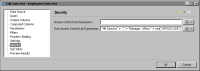
You can also apply security to rows in a data set, which is a typical approach. To do so, specify the security IDs in Row Access Control List Expression. Figure 33‑14 shows an example where the expression specified for the Row Access Control List Expression property is:
Figure 33‑14 Data security applied to data set rows
Security applied to data set rows acts as a filter. In the example shown in Figure 33‑14, the HR Director can view all rows in the data set. Managers can view only rows that pertain to their department as specified by the office code.
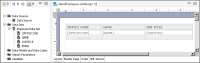
Figure 33‑15 shows a report design that uses the secured data object. In the design, a table contains data elements that access the data set columns in the data object.
Figure 33‑15 Report design that uses data from a data set in a secured data object
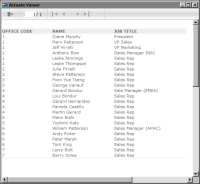
When run and viewed by the HR Director, the report displays all the rows in the data set, as shown in Figure 33‑16.
Figure 33‑16 Preview of the report for the HR Director user group
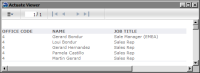
When run and viewed by the manager of a specific office code, the report displays only the rows for that office. Figure 33‑17 shows the report thatManager: Office 4 sees.
As the example shows, applying security to data set rows is useful for creating a single data set that provides different data to different users.
Figure 33‑17 Preview of the report for the Manager: Office 4 user group
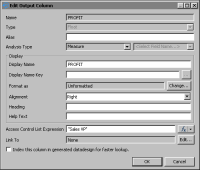
You can also apply security to each column in a data set. For example, you can restrict a profit/loss column or a salary column to users with executive‑level user groups. To do so, select Output Columns, select the column, then specify the security IDs in Access Control List Expression. Figure 33‑18 shows an example where the expression specified for a column’s Access Control List Expression property is:
"Sales VP"
Figure 33‑18 Data security applied to a column in a data set
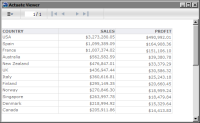
In the example, only users with the Sales VP user group can access data in the PROFIT column. Figure 33‑19 shows a report using the PROFIT column and how the report appears to a user with the Sales VP user group.
Figure 33‑19 Preview of the report for the Sales VP user group
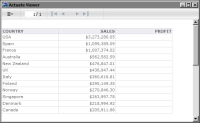
Figure 33‑20 shows the same report, but as viewed by a user without the Sales VP user group. There is no data in the PROFIT column; only the PROFIT label appears in the table header. To hide the entire column if there is no data, set the column’s Visibility property to an expression, such as the following:
row["PROFIT"] == null
Figure 33‑20 Preview of the report for user groups other than Sales VP
Security at the column level also controls the availability of certain columns to users designing a dashboard in Dashboards or a report in Report Studio.
Adding security to a cube
To apply security to a cube, in the cube builder, choose Security, then specify the security IDs in Access Control List Expression. Figure 33‑21 shows an example where the expression specified for the Access Control List Expression property is:
"CEO" + "," + "CFO" + "," + "Sales VP"
Only users with the CEO, CFO, or Sales VP user group have access to the cube. For example, in a report that contains a cross tab using the secured cube, only the CEO, CFO, and Sales VP can view the data in the cross tab. Other users see an empty cross tab. Similarly, in Report Studio or Dashboards, only users with those user groups can see or use the secured cube in their report designs or dashboards.
Figure 33‑21 Data security applied to a cube
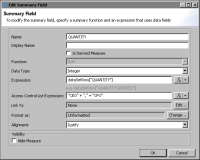
Within a cube, you can limit access to each measure and dimension. For example, you can restrict a profit measure to users with executive-level user groups. In the cube builder, choose Groups and Summaries, select the dimension or measure, then specify the security IDs in the Access Control List Expression property.
Figure 33‑22 shows an example where the expression specified for a measure’s Access Control List Expression property is:
"CEO" + "," + "CFO"
In a report that contains a cross tab that uses this cube, only the CEO and CFO can view the QUANTITY data in the cross tab.
Figure 33‑22 Data security applied to a cube measure
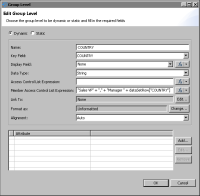
With a dimension, you can also restrict access according to the dimension’s values, or members. For example, you can provide executives access to sales data for all countries and restrict managers to sales data for their respective countries. Figure 33‑23 shows security applied to the members of a Country dimension. The expression specified for the Member Access Control List Expression property is:
In this example, the Sales VP can view data for all countries. Managers can view only data for their country.
Figure 33‑23 Data security applied to members of a dimension
Notice that the Group Level dialog box, as shown in Figure 33‑23, displays two ACL properties. Access Control List Expression controls access to the dimension (users either have access to the entire dimension or not at all), whereas, Member Access Control List Expression controls access to specific data within the dimension.
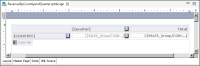
Figure 33‑24 shows a report design, which uses the data object that contains the cube with security applied to its country dimension. In the report design, a cross tab uses data from the cube to display sales totals by country and by quarter.
Figure 33‑24 Report design that uses data from the secured cube
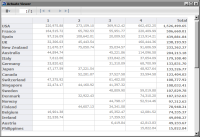
When the report is run and viewed by a user with the Sales VP user group, the cross tab displays sales data for all countries, as shown in Figure 33‑25.
Figure 33‑25 Preview of the cross tab for the Sales VP user group
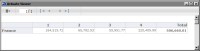
When the report is run and viewed by the manager of a specific country, the cross tab displays only sales data for his or her specific country. Figure 33‑26 shows the cross tab that the Manager France user group sees.
Figure 33‑26 Preview of the cross tab for the Manager France user group
Enabling and disabling data security
For ACLs to take effect, you must enable data security in the data object. If you decide later to make all the data in the data object available to users, all you do is disable data security. You do not have to remove the ACLs.
How to turn data security on or off
1 In the layout editor, right-click in an empty area of the data object design, then select Security.
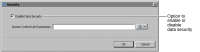
2 In Security, shown in Figure 33‑27, either select or deselect Enable Data Security.
Figure 33‑27 Enabling data security
Testing data security
BIRT Designer Professional supports the simulation of viewing reports with data security. You can test data security in a report without having to publish the report to iHub, log in with different user credentials, run the report and verify its output.
To test data security from the perspective of a user designing a dashboard in Dashboards or a report in Report Studio, you need to run tests on the iHub. The testing procedure entails the following steps:
Publishing the data object (.data file) to an BIRT iHub volume
Sharing the data object with selected users or user groups, and assigning the Secure Read privilege
Logging in with each user credential
Launching the dashboard design tool or Report Studio, and using the data object as a source of data for the dashboard or report
How to test data security in a report in BIRT Designer Professional
1 Using BIRT Designer Professional, build a report that uses a secure data object store (.data) as its data source.
2 When you finish building the report, choose Run➛View Report with Data Security, and select the output format in which to view the report.
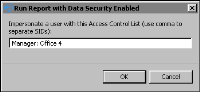
3 In Run Report with Data Security Enabled, shown in Figure 33‑28, type a security ID specified in an ACL in the data object. For example:
Manager: Office 4
Figure 33‑28 Running a report with data security using a specified security ID
Choose OK.
The report runs and displays only the content that the specified security ID can view.
4 Repeat the previous step until you finish testing all the security IDs used in the report.