This section describes some general principles and provides a few examples for organizing subreports in a report. The three report elements that you use to organize subreports are the table, list, and grid. Reports with complex layouts typically use all three of these container elements.
The table iterates through the rows in a data set and displays the data in row and column format. For some reports, a subreport consists of data that is organized in a table.
The list also iterates through the rows in a data set. The list, however, provides much greater flexibility for arranging data. A report that contains multiple linked subreports typically uses a list as the top‑level container. Within the list, subreport data can be organized in tables.
The grid is a static table that organizes elements in rows and columns. In a report that includes subreports, use a grid to align multiple tables horizontally or to add space between tables. For example, to display two subreports next to one another, create two tables to display the data for the subreports, then insert both tables in a grid to align the subreports.
Building a report with independent subreports
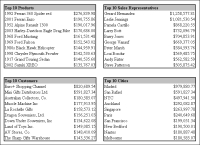
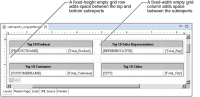
Figure 14‑1 shows an example of a report that has four unlinked subreports. Each Top 10 subreport displays a different set of data. Each subreport is a table with data elements. The tables are arranged in a grid so that they appear side by side.
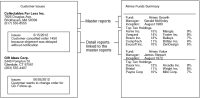
The preceding section described subreports that are not linked to each other. The subreports run independently and do not coordinate their data. Sometimes, however, you need to create reports that are linked to one another, such as a detailed customer-issues report in a customer report, or a list of top 10 stocks in a fund report. Figure 14‑3 shows these two example reports.
Figure 14‑3 Two reports containing linked subreports
As each example report shows, one report is nested in another, creating a master report and detail report relationship. Each report accesses data from a different table or data source, and the reports are linked by a common field value, such as customer ID or mutual fund name. The value of the linking field in the master report determines the data that appears in the detail report. For example, if the customer ID in the master report is 112, the detail report displays the issues for the customer whose ID is 112.
Creating the structure of a report with linked subreports
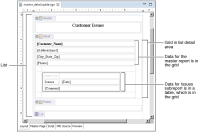
The master-detail report examples in the previous section use the list element as the primary organizational structure. The list iterates through the data rows that the data set returns, and supports the structure of nested reports.
Within the list, a grid aligns the data in both reports. The data for the master report is placed in the grid in the detail area of the list. The grid aligns the data in a column, and the list iterates through the master report’s data rows. The detail report uses a table to iterate through its data rows.
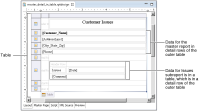
This structure assumes that the master and detail reports use different data sets and that each data set accesses data from a different table or data source. Figure 14‑4 shows the report design for the Customer Issues master-detail report that appears in the previous section.
Figure 14‑4 Report design for linked subreports using the list element
An alternate design technique is to use two tables, one nested in the other. Place data for the master report in the detail rows of the outer table. Place data for the detail report in a table, and place the table in the detail row of the outer table. Figure 14‑5 shows this alternate report design.
Figure 14‑5 Report design for linked subreports using nested tables
Linking master and detail reports
Master and detail reports must be linked by a common field. In the customer‑issue example report, the linking field is the customer ID. To link the reports, perform the following tasks:
1 For the detail report’s data set, create a SELECT statement with a parameter marker in a WHERE clause. For example:
SELECT *
FROM issues
WHERE issues.customerNumber = ?
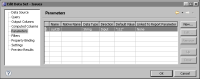
2 Create a data set parameter. Figure 14‑6 shows the definition of a parameter in the data set that the detail report uses. Supply a specific value as the parameter’s default value so that you can test the query.
Figure 14‑6 Data set parameter definition
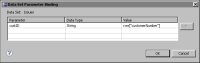
3 In the layout editor, select the detail table, and use the property editor’s Binding page to bind the detail report’s data set parameter to the linking field in the master report. Figure 14‑7 shows an example of this binding.
Figure 14‑7 Data set parameter bound to the linking field
When the report runs, BIRT performs the following tasks:
When the master report processes a customer row, it passes the customer number value to the data set parameter defined for the detail report.
The data set parameter passes this customer number value to the detail report’s query and dynamically updates the WHERE clause.
The detail report displays the issues data for that customer number.
The previous steps repeat until the master report processes all its customer rows.