The priority assigned to overlapping parts of a chart element, Flash object element, or a report. Parts having a higher Z-order hide parts having a lower Z‑order.
1 The order in which a combination, multiple y-axis, or three-dimensional chart element displays the chart series. The example in Figure G‑9 shows a bar series having a Z‑order of 1 and an area series having a Z‑order of 0.
Figure G‑9 Multiple y-axis chart having bar series in front of area series
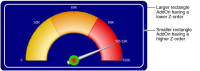
2 The order of AddOns providing decoration to a Flash object element. For example, Figure G‑10 shows a meter chart having a background of two rectangle AddOns. The smaller rectangle, having a higher Z-order than the larger rectangle, appears in front of the larger rectangle.