A stock chart displays a stock’s open, close, high, and low values for a set of trading dates. A stock chart can show the data for one stock or for multiple stocks. Although a stock chart is typically used to display stock data, you can also use it to chart other values such as four daily temperature values for a set of dates: high, low, sunrise, sunset. The stock chart has two subtypes: the candlestick and bar stick stock charts.
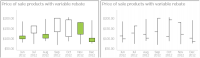
A candlestick stock chart consists of a series of boxes with lines extending up and down from the ends, as shown in the chart on the left in Figure 9‑9. The top and bottom points of each line indicate the high and low values, respectively. The top and bottom of each box indicate the open and close values. If the close value is higher than the open value, the box is white. If the open value is higher than the close value, the box is shaded. This style enables you to see immediately whether a value posted a gain or a loss for a given day.
Figure 9‑9 A candlestick and bar stick stock chart
A bar stick stock chart consists of a series of vertical bars with horizontal tick marks, as shown in the chart on the right in Figure 9‑9. The top and bottom points of each bar indicate the high and low values, respectively. The horizontal tick marks indicate the open and close values. The tick mark on the left of the bar is the open value. The tick mark on the right of the bar is the close value. A bar stick stock chart typically shows the change in price over a period of time. The candlestick stock chart shows the gain or loss pattern more clearly than the bar stick stock chart.