Working with difference charts
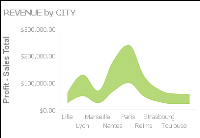
A difference chart shows a variation between two sets of data by shading the area between points of comparison. A difference chart is useful when you want to display the deviation between two sets of data values, as shown in
Figure 9‑11
.
Figure 9‑11
A difference chart