Interactive Viewer supports modifying tube, cone, and pyramid charts. These chart types are variations of the bar chart that use tubular, conical, and pyramid-shaped risers in place of bars. You use a bar, tube, cone, or pyramid chart to display data values as a set of vertical or horizontal columns.
You can use Interactive Viewer to modify the subtype of tube, cone, and pyramid charts to side‑by‑side, stacked, or percent stacked, depending on which type best represents the data being used.
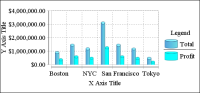
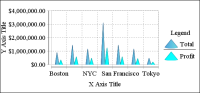
The charts shown in Figure 9‑14, Figure 9‑15, and Figure 9‑16 use the same data, profit and revenue by sales office, to illustrate these different chart types.
Figure 9‑14 A tube chart showing profit and revenue by sales office
Figure 9‑15 A cone chart showing profit and revenue by sales office
Figure 9‑16 A pyramid chart showing profit and revenue by sales office