The basic characteristics of a chart are determined in the report design. You can modify the chart in Interactive Viewer in the following ways:
Change the chart subtype.
Filter data.
Format the chart.
To choose any of these options, select the chart to highlight it, then right‑click the chart area to display the context menu containing these options.
Changing chart subtype
If a type of chart offers subtypes, you can change the subtype in Interactive Viewer.
How to modify the chart subtype
1 Select and right‑click the chart. Choose Change Subtype.
2 In Chart Subtype, choose an option from the available subtypes. Choose OK to apply your selection.
Filtering chart data
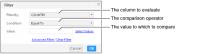
You can filter chart data in the same way that you apply filters to data in a report column. In a chart, you can filter data on the x‑axis or the y‑axis. Select and right‑click the chart, then choose Filter➛Filter. Filter appears, as shown in Figure 9‑17.
Figure 9‑17 Creating a filter condition for a chart
Complete the steps to create one or more filter conditions, based on which data is displayed on the axes of the chart.
When filtering a Gantt chart, the value set as the task label and the value by which legend items are grouped can impact the filtered data displayed. For example, in a Gantt chart displaying order processing times, if the task label is set to Country and the legend is grouped by product line, specifying a filter on the country column appears to display data for the selected country. However, because the tasks are aggregated by product line, each bar in the Gantt chart contains data aggregated by product line for several countries, even though the task label displays the name of a single country specified in the filter condition. So although the filtered data is accurate, it can appear confusing to the user.