Each gadget has a different set of formatting properties, which change specific aspects of the gadget’s appearance. Figure 9‑38 displays the formatting options you can modify in a linear gauge gadget. Figure 9‑39 and Figure 9‑40 display the Format Gadget dialog box for the linear gauge gadget.
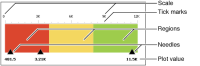
Figure 9‑38 Formatting options displayed for a linear gauge gadget
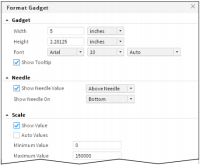
Figure 9‑39 Formatting gadget dimensions, needle values, and scale
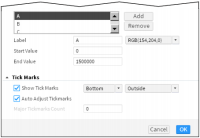
Figure 9‑40 Formatting gadget region and tick marks
For a linear gauge gadget, you can modify a set of general formatting options, as well as needle, plot, scale, region, tick marks, and value properties.
The following section describes the formatting options you can modify for each type of gadget.
Modifying general properties
General properties of a gadget control overall appearance, such as color, size, and font properties. General properties can also define the title text, tooltip, and orientation for specific gadget types. Table 9‑2 describes the general formatting properties available to specific gadgets, and their usage.
Table 9‑2 Formatting general properties
Option
Gadget
Usage
Color
Bullet, cylinder, thermometer
Sets the color of the gauge.
Font
All
Set the font type, size, style, and color of displayed values. You can select a standard color using color picker, or specify a custom color.
Height
All
Specifies the height of the gadget.
Orientation
Bullet
Specifies whether to display the gadget horizontally or vertically.
Title
Sparkline, bullet
Adds a title to the gadget.
Tooltip
Linear gauge, meter
Specifies text for the tooltip.
Width
All
Specifies the width of the gadget.
Modifying needle properties
Needle properties define the position of a needle. A needle appears only in a linear gauge and in a meter gauge. Table 9‑3 describes the needle properties you can modify in Interactive Viewer.
Table 9‑3 Formatting needle properties
Option
Gadget
Usage
Show Needle On
Linear gauge, meter
Specifies the position of the needle
Show Needle Value
Meter
Displays or suppresses the value to which the needle points, and specifies the display position for the values
Modifying plot properties
Plot properties control the appearance of elements in the data plot area of bullet and sparkline gadgets. In both gadgets, you can specify whether to display or hide plot values.
Additionally, in a sparkline gadget, you can specify whether to display the open, close, lowest, or highest values. Table 9‑4 describes the plot properties you can modify using Interactive Viewer.
Table 9‑4 Formatting plot properties
Option
Gadget
Usage
Show Close Value
Sparkline
Enables and disables the display of the close value
Show High and Low Values
Sparkline
Enables and disables the display of the high and low values
Show Open Value
Sparkline
Enables and disables the display of the open value
Show Plot Value
Bullet, sparkline
Displays or suppresses the plotted values
Modifying scale properties
Scale properties define the range of values and the number of tick marks that a gadget displays. The scale properties affect the numbers displayed on the gadget, not its size. Minimum Value and Maximum Value specify the lowest and highest numbers, respectively. However, if the data set value (represented by the needle value) is lower than the minimum value or higher than the maximum value, the minimum or maximum value is ignored. Table 9‑5 describes the scale properties you can modify using Interactive Viewer.
Table 9‑5 Formatting scale properties
Option
Gadget
Usage
Auto Values
All
Enables a scale to be specified by Interactive Viewer
Maximum Value
All
Sets the highest value of the scale
Minimum Value
All
Sets the lowest value of the scale
Show Value
Cylinder, meter, bullet, linear gauge
Shows values of the scale
Modifying region properties
Region properties enable the division of the data plot into regions. Use regions to provide more information about values in a gadget. Table 9‑6 describes the region formatting properties you can modify in Interactive Viewer.
Table 9‑6 Formatting region properties
Option
Gadget
Usage
Color
Linear gauge, meter, bullet
Specifies the color of the region.
End Value
Linear gauge, meter, bullet
Specifies where the region ends.
Label
Linear gauge, meter, bullet
Specifies the name of the region.
Region
Linear gauge, meter, bullet
Chooses the region for which the settings apply. You can also add or remove a region from the list.
Start Value
Linear gauge, meter, bullet
Specifies where the region starts.
Show Labels
Linear gauge
Displays or suppresses the region labels.
Modifying tick marks
Ticks properties define the position and count of tick marks on a gadget. Tick marks can appear in the positions listed in Table 9‑7.
Table 9‑7 Formatting tick marks
Option
Gadget
Usage
Auto Adjust Tick Marks
All but sparkline
Enables or disables tick marks created evenly across the scale
Position
Cylinder, thermometer
Positions tick marks on the right side of the gadget
Position Above
Linear gauge, meter, bullet
Sets tick marks to appear above the gadget
Position Below
Linear gauge, meter, bullet
Sets tick marks to appear below the gadget
Position Left
Cylinder, thermometer
Positions tick marks on the left side of the gadget
Show Tick Marks
Linear gauge, meter, bullet, cylinder, thermometer
Enables or disables the display of tick marks on the gadget
Show Tick Values
Linear gauge, meter, bullet, cylinder, thermometer
Enables or disables the display of values on tick marks
Major Tickmarks Count
All but sparkline
Specifies the number of tick marks to display on the scale
Modifying the value property
You can also display or hide the value in a cylinder or thermometer gadget, as described in Table 9‑8.
Table 9‑8 Formatting the value property
Option
Gadget
Usage
Show Value
Cylinder, thermometer
Displays or hides the value illustrated in the gadget
How to format a gadget
To format a gadget, select and right‑click the gadget. Choose Format Gadget and modify the information on Format as needed.