You can compare values in a cross tab’s rows or columns and display the difference between the values. For example, you can compare profit from quarter to quarter or year to year, or between different product lines or sales offices.
The following are known limitations of comparative calculations in a cross tab:
Grand totals are not supported.
Pivot is not supported.
If you are comparing computed values, you can compare the values in rows, but not in columns.
Comparing numeric computed values that use the FIRST or LAST functions is not supported in iHub3.1.1.
Consider the cross tab in Figure 10‑2, which shows the profit for the Classic Cars and Motorcycles product lines for the London and New York sales offices.
Figure 10‑2 Cross tab with two rows and two columns
You can compare the profit values for Classic Cars and Motorcycles and display the difference, as shown in Figure 10‑3.
Figure 10‑3 Displaying the difference between the values in two rows
You can also compare the profit values for London and New York and display the difference, as shown in Figure 10‑4.
Figure 10‑4 Displaying the difference between the values in two columns
You can display the difference for more than one measure, as shown in Figure 10‑5.
Figure 10‑5 Displaying the difference for more than one measure
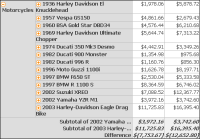
You can display the difference between two rows in a subcategory. Figure 10‑6 shows the difference between the values in the last two rows in the product subcategory and the subtotals for each product.
Figure 10‑6 Displaying the difference between two rows in a subcategory
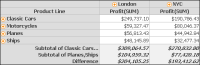
You can display the difference between sums of values. Figure 10‑7 shows the difference between the profit for Classic Cars and Motorcycles and the profit for Planes and Ships.
Figure 10‑7 Displaying the difference between sums of values
How to compare values in a cross tab
1 In a cross tab report or gadget, right-click a row or column heading and choose Compare.
2 In Compare, do the following, then choose OK:
1 In Label, type a label for the difference value or accept the default value.
2 In First Label, type a label for the first value(s).
3 In First Value(s), select the appropriate category. To display subcategories, click the greater than symbol (>). Use Ctrl+click to select multiple categories or subcategories.
4 In Second Label, type a label for the second value(s).
5 In Second Value(s), select the appropriate category or subcategory. The second value(s) must be at the same level as the first value(s). The difference is equal to the first value minus the second value, or the sum of the first values minus the sum of the second values.
6 To show subtotals, as shown in Figure 10‑6 and Figure 10‑7, select Show comparative subtotal rows/columns.
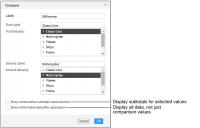
7 If the cross tab contains a large number of rows or columns, make sure Show all the table data after calculation is deselected. Figure 10‑8 shows the Compare dialog.
Figure 10‑8 Comparing values in two categories
Modifying a comparison
To modify a comparison, right-click a row or column heading and choose Edit Compare. Then, make the necessary changes in the Compare dialog, shown in Figure 10‑8. Choose OK.
Removing a comparison
To remove a comparison, right-click a row or column heading and choose Remove Compare. Choose OK to confirm.