In Interactive Crosstabs, you can create filter conditions at the cross tab level to narrow the scope of data displayed and make the cross tab easier to use. You can also create filters for dimensions and measures present in the cross tab’s cube or data model, but not in use in the cross tab.
Using filters can limit the ability to drill up or down to view summary or drill detail data in a cross tab. When you create a filter condition, take into consideration the data values you need to view and the trends or relationships that you aim to analyze. If you need to save a cube view (.cubeview) file or a BIRT document (.rptdocument) file, and share it with other users for analysis, consider how any filters you applied can limit the ability for others to drill up or drill down the data hierarchy.
When you apply a filter condition, select Recalculate Totals to enable Interactive Crosstabs to recalculate totals for the filtered data. If you want to retain existing totals for comparison with the filtered cross tab data, deselect Recalculate Totals. In this case, the cross tab displays columns and rows based on the filters you apply, but the original totals for the unfiltered data remain.
Creating a filter at the cross tab level
When you create a filter condition in Interactive Crosstabs, you specify the dimension, measure, row, or column to evaluate, select a comparison operator, and specify a value to which to compare, as you did when creating a filter in Interactive Viewer. Defining a filter condition at the cross tab level displays only a subset of data retrieved from the cube or data model data source.
You can also create a slicer filter condition for dimension or measure data fields in the cube or data model data source that are not in use in the cross tab. Slicer filters limit the data retrieved from the cube or data model. This filter is specifically useful when working with cubes or data models containing large amounts of data.
For more information about comparison operators to use when you create filter condition expressions, see Functions and operators.
How to create a filter at the cross tab level
You can use this procedure to create a filter condition using an attribute, dimension, or measure value from the cross tab.
1 Right‑click a cross tab cell that contains a value to evaluate. From the menu, choose Filter➛Filter. Filter appears.
2 In Filter, complete the following steps:
1 In Apply To, select a location to apply the filter condition. Depending on the cell you selected in step 1, the following options appear:
All Measures
Row
Column
2 Select the comparison operator for the filter condition based on which Filter displays either one or two additional fields or a completed condition.
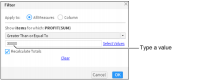
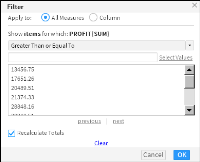
If you choose All Measures as the location to apply the filter condition, you can type a value to compare to, or select from a list of values. Proceed to step 3.
If you choose Row or Column as the location to apply the filter condition, based on the comparison operator you select, do one of the following:
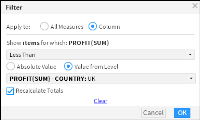
4 Choose Value from Level to compare to a specific dimension level value. The example filter condition in Figure 10‑24 displays Profit values in the cross tab that are less than the Profit values for the UK dimension level.
Figure 10‑24 Selecting a value from a dimension level
5 Select Recalculate Totals to display cross tab totals based on the filter condition you defined.
Choose OK to apply the filter condition.
Creating a slicer filter
In Interactive Crosstabs, you can also create a filter condition for an attribute or dimension field that is not currently in use in the cross tab, but present in the cube or data model data source. Defining a filter condition for fields in the cube or data model limits the data retrieved for the cross tab.
How to create a slicer filter
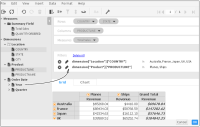
From the data pane, drag an attribute or dimension field and drop it in the Filters area of the structure pane. The example in Figure 10‑25 shows dragging the Year dimension to the Filters area to create a filter condition. The Filters area displays all the filter conditions applied in the cross tab.
Figure 10‑25 Dragging a dimension from the data pane to the Filters area
Filter appears. Specify a filter condition as you did when creating a filter at the cross tab level. For more information, see How to create a filter at the cross tab level. You can edit or delete filter conditions by selecting the condition in the Filters area, and choosing an action.
Interactive Crosstabs also supports using relative time period operators when creating a filter condition for a data field that contains date‑and‑time data. If you specify a reference date, Interactive Crosstabs performs comparisons based on the following relative time period operators:
Month to date
Month to date last year
Quarter to date
Quarter to date last year
Year to date
Year to date last year
For example, if the reference date is March 4, 2011, the relative time period, year‑to‑date last year, is January 1, 2010 to March 4, 2010.