Using Interactive Crosstabs you can organize cross tab data in the following ways:
Sort data in a column in ascending or descending order.
Add, remove, or reorder attribute, dimension, and measure columns.
Pivot the cross tab, which transposes the columns and rows axes.
Drill down to display details or drill up to display summary information.
The following section describes these actions in more detail.
Sorting data in a cross tab
You can sort data in a cross tab to display the content in a meaningful order. A sales cross tab is more useful if it presents sales figures from highest to lowest, or the reverse, if you want to see lowest to highest performers. The default sort order in a cross tab displays data sorted by dimension values. The column and row heading values, which are dimensions, appear in ascending order.
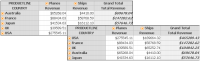
Compare the cross tabs in Figure 10‑9. The cross tab on the left displays sales revenues for products by alphabetically sorted country names. The cross tab on the right displays the same data, with sales revenues sorted from the highest to lowest in the grand total column.
Figure 10‑9 Comparing cross tabs that contain sorted data
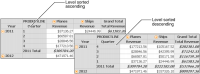
Interactive Crosstabs supports sorting values in a column or row. For dimension‑level groups, you can specify a sort order for fields in the hierarchy. For example, you can specify an ascending or descending sort order for the time period hierarchy of year and quarter, as shown in Figure 10‑10.
Figure 10‑10 Sorting data on a level
How to sort data
1 Right‑click a cell, and choose Sort.
In Sort, Sort By displays the value by which you can sort.
2 In Sort On, as shown in Figure 10‑11, select an option from the list.
Figure 10‑11 Sorting data on a column
3 In Sort Direction, select Ascending or Descending. Choose OK.
How to revert back to the default order
1 To revert data to its original order, for a column, dimension level, or row, right‑click a cell and choose Sort.
2 In Sort, select None. Choose OK.
Managing columns in a cross tab
Using Interactive Crosstabs you can add or delete one or more dimension, measure, or attribute columns from the available data in the cube or data model data source to the cross tab. The following section describes how to add, remove, and reorder dimension columns to a cross tab.
How to add a dimension to cross tab columns or rows
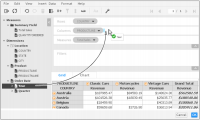
Drag a dimension from the data pane, and drop it in Columns or Rows in the structure pane. Figure 10‑12 shows dragging a Year dimension from the data pane and dropping it in Columns in the structure pane.
Figure 10‑12 Adding a Year dimension to cross tab columns
Interactive Crosstabs updates the cross tab, adding the Year dimension to each PRODUCTLINE column.
How to remove a dimension from cross tab columns or rows
In the structure pane, in Columns or Rows, right-click a dimension, such as the Year dimension. Then, choose Delete.
How to change the order of dimensions
In the structure pane, in the list of dimensions, drag a dimension from its current position, and drop it in a new position. For example, drag the Year dimension from the left to the right of the PRODUCTLINE dimension.
How to add, remove, or move a measure column in a cross tab
To add a measure, drag the field from the data pane, and drop it in Measures in the structure pane. To remove a measure, in the structure pane, in Measures, right‑click a measure and choose Delete. To reorder measures, in the structure pane, in the list of measures, drag a measure from its current position, and drop it in a new position. For example, in a cross tab displaying Revenue and Profit measures, drag the Profit measure and place it to the left of the Revenue measure.
How to add, remove, or move an attribute column in a cross tab
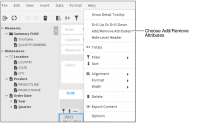
1 Right-click the dimension heading for which you want to add or remove an attribute value. Then, choose Add/Remove Attributes, as shown in Figure 10‑13. The following example shows how to remove a DateTime attribute value.
Figure 10‑13 Choosing Add or Remove Attributes
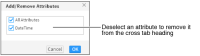
2 In Add or Remove Attributes, deselect the DateTime attribute to remove it, as shown in Figure 10‑14.
Figure 10‑14 Deselecting an attribute to remove it from the cross tab
Choose OK.
Interactive Crosstabs updates the cross tab, removing the attribute, as shown in Figure 10‑15.
Figure 10‑15 Displaying the cross tab without the DateTime attribute
Viewing detail or summary data
Typically, a cross tab displays data in a hierarchy, specified in the cube or data model data source. For example, a cross tab might display data by country, state, and city, or by year, quarter, month, and day. Interactive Crosstabs supports drilling up to display higher-level summary information, or drilling down to display detail information. Hiding details, particularly for a cross tab that runs into hundreds of pages, helps you view key information at a glance.
Because viewing details for a very lengthy cross tab report can cause performance issues, Interactive Crosstabs provides the option of specifying the number of data row to retrieve for a drill down action. Interactive Crosstabs also limits the displayed page size to approximately 33 MB. Displaying a larger cross tab can freeze the browser. The following message appears if you attempt to display an oversize cross tab page:
Oversize page content can freeze your browser. Open the options dialog to apply page break or open the drill dialog to apply the appropriate filter to reduce its size.
You can hide details to reduce the size of a cross tab. Additionally, a BIRT iHub system administrator can change the value of the MAX_PAGE_SIZE parameter in web.xml to display a larger cross tab. You can also use Options to specify a smaller drill size during a drill‑down action.
How to hide or show details
In the structure pane of a cross tab that consists of multiple dimensions in Columns or Rows, do the following:
Right‑click the dimension for which you want to show or hide details. Select Show detail or Hide detail from the context menu.
How to drill up or down dimension hierarchies
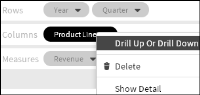
1 In the structure pane, in Rows or Columns, right-click a dimension and choose Drill Up Or Drill Down. The example in Figure 10‑16 shows the selection of this option for the Product Line column.
Figure 10‑16 Choosing Drill Up Or Drill Down for columns
Drill Up Or Drill Down appears.
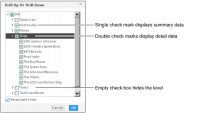
2 In Drill Up Or Drill Down, select items from the list for which Interactive Crosstabs displays detail data. For example, in Figure 10‑17, double check marks for the Ships product line indicate that detail data for this dimension is available in the cross tab. Single check marks for the Motorcycles and Planes product lines indicate that summary data is displayed in the cross tab for these dimensions. The Classic Cars, Trains, and Trucks and Buses product lines are deselected, indicating that these dimensions are not displayed in the cross tab.
Figure 10‑17 Specifying Drill Up Or Drill Down properties
3 To recalculate the totals displayed in the cross tab based on the selections made, if necessary, select Recalculate Totals.
Choose OK.
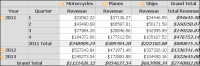
Figure 10‑18 shows part of a cross tab that displays detail data for products in the Ships product line and summary data for the Motorcycles and Planes product lines.
Figure 10‑18 A cross tab displaying detail and summary data
4 You can also specify the drill size when drilling down into rows or columns to view detailed data. Complete the following steps:
Choose Options.
In Options, select Drill Size. In Max Drill Size, type the number of data rows for which aggregate values are calculated in the cross tab.
Choose OK.
Viewing details for cross tab data
Displaying detail tooltip information is specifically useful if you are analyzing data in a large cross tab where you cannot simultaneously view the column heading, row heading, and data cell in your browser window.
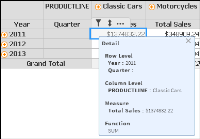
To view details, right-click any cell in the detail area, and choose Show Detail Tooltip. A tooltip displays the column and row-level details, the measure value, and which aggregate function applies for the selected cell, as shown in Figure 10‑19.
Figure 10‑19 Viewing details about cross tab data
Pivoting a cross tab
Pivot a cross tab to transpose the axes. Pivoting a cross tab provides users with a different perspective on the displayed data. Figure 10‑20 displays a cross tab before pivoting the axes.
Figure 10‑20 Before pivoting axes
Figure 10‑21 displays the cross tab after pivoting the axes.
Figure 10‑21 After pivoting axes
How to pivot a cross tab
In Interactive Crosstabs, choose Pivot.
Interactive Crosstabs pivots the cross tab, displaying the year dimension as the column headings and the product line dimension as the row headings.