Each detail cell in a cross tab contains an aggregate data value. Interactive Crosstabs supports creating additional aggregate calculations to these values. For example, in addition to displaying the total profit generated by product line by geography, you can also display the average profit. The functions available for aggregate calculations in Interactive Crosstabs are similar to those in Interactive Viewer, with a few additions.
Additionally, you can add a new computed measure column to a cross tab. The calculation functions available are based on EasyScript and are similar to those available in Interactive Viewer. You cannot apply aggregation to a computed measure.
Because meaningful data analysis requires displaying data in time intervals, Interactive Crosstabs supports calculating data using relative time periods, such as current month, current year, month to date, quarter to date last year, trailing 30 days, and trailing 6 months.
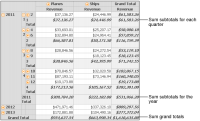
You can use various available aggregate functions to evaluate column and row totals and group subtotals as aggregate data values. For example, Figure 10‑26 displays the following aggregate data values in the Planes and Ships columns:
The revenue sum for each numbered month
The quarterly revenue subtotals, labeled 1 Total and 2 Total, and so on, for the 2011 year
The annual subtotals, labeled 2011 Total, for each year
The total revenue sum for each column, labeled Grand Total
Figure 10‑26 Displaying subtotals and grand totals
You can display the grand totals and subtotals on columns and rows either before or after the detail values.
You can use the Options dialog box to specify the location of grand totals and subtotals in the cross tab.
Adding a computed measure
To display computed data in a cross tab, you can create a column that displays calculated data based on an expression that Interactive Crosstabs evaluates. For a complete list of supported functions and their descriptions, see Functions and operators.
Working with relative time periods
Because analysis of stock performance, revenue, or productivity is typically meaningful only if it can be measured over time, such as by day, week, month, quarter, or year, Interactive Crosstabs supports several useful relative time period functions. For example, a cross tab can display revenue data for a particular month, quarter, or year. Figure 10‑27 displays sales revenue by region by quarter for two years.
Figure 10‑27 Displaying sales revenue by region by quarter for two years
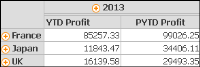
Displaying data by relative time periods supports, for example, the comparison of current data with past data of the same period. Figure 10‑28 shows profit year‑to‑date 2013 values, using the date 11/30/2013, and the comparable year‑to‑date values for the previous year for France, Japan, and the UK.
Figure 10‑28 Displaying profit year-to-date in 2013 and previous year‑to‑date
How to create a calculation using a relative time period
1 In Interactive Crosstabs, choose New Computed Measure. Computed Measure appears.
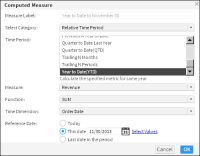
2 In Computed Measure, shown in Figure 10‑29, complete the following steps. The procedure can differ based on the selected category and time period.
In Measure Label, type a name for the new measure. The name you specify appears in the heading.
In Select Category, select Relative Time Period.
In Time Period, select a time period from the list. For example, select Year to Date.
In Measure, select a measure to which to apply the function. For example, select Revenue.
In Function, select one of the following aggregate functions to apply to the measure:
AVERAGE
COUNT
MAX
MIN
SUM
Figure 10‑29 Creating a year-to-date computed measure
For example, select SUM to display the sum values for each year.
In Time Dimension, select a dimension to which to apply the function.
In Reference Date, select one of the following options:
To use today’s date as the reference date, select Today.
To specify a date, select This date. Then, type a date or choose Select Values to display the calendar tool from which you select a date. For example, select This date and type 11/30/2013.
To specify the last date in the available time period, select Last date in the period.
Choose OK.
The cross tab displays the computed measure values, as shown in Figure 10‑30.
Figure 10‑30 Displaying the Year-to-Date to November 30 computed measure
Using the * to Date and Trailing N * time periods
Interactive Crosstabs calculates time periods, such as Month to Date, Month to Date Last Year, Quarter to Date, Quarter to Date Last Year, Previous Month to Date, Previous N Year to Date, Next N Periods, and Trailing N Periods, using the year, month, and day parts of a reference date. For example, Month to Date covers the period starting at the beginning of the reference date’s month and ending at the reference date. If the reference date is 2012-01-08, the period is 2012‑01-01 to 2012‑01-08. Contrast this with Current Month, which is calculated using only the year and month parts of a reference date. For a reference date of 2012-01-08, Current Month covers the entire month, 2012-01-01 to 2012-01-31.
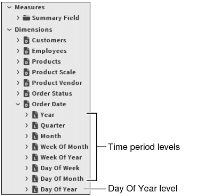
Because the * to Date and Trailing N * time periods use the day part of a reference date, the time dimension defined in the cube must include the Day Of Year level. Figure 10‑31 shows a cross tab data pane displaying time period levels, including the Day Of Year level.
Figure 10‑31 Displaying time period levels in the data pane
If the time dimension in the cube does not include the Day Of Year level, and you use a * to Date or a Next N * or Trailing N * time period in a relative time period calculation, the measures display the wrong results. Month to Date returns the same results as Current Month, Quarter to Date returns the same results as Current Quarter, and so on. In other words, the day part of the reference date has no effect.