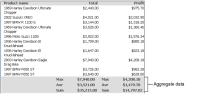
One of the key features of any report is the ability to display summary, or aggregate, data. Aggregating data involves performing a calculation on a set of values. The listing BIRT design in Figure 10‑1 displays aggregate data for the Total and the Profit columns at the end, or footer, of the table.
Figure 10‑1 Displaying aggregate data in a simple listing report
Creating aggregate data
When you aggregate data in a selected column, you specify the following information:
The type of aggregate calculation. For each column, you can display a maximum of three aggregations.
Whether to perform the aggregate calculation across all the data rows in the table, or across the data rows in each group, or both.
Whether to display the aggregate data in the footer or header of the table or the groups.
The aggregate calculations you can perform on a column depend on the column’s data type. For descriptions of the supported aggregate functions, see Functions and operators.
How to aggregate data
1 Select and right‑click the column that contains the data to aggregate.
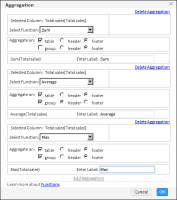
2 Choose Aggregation. Aggregation appears, as shown in Figure 10‑2.
3 In Select Function, select the aggregate function to use.
Figure 10‑2 Defining three aggregations
4 In Aggregate on, do the following:
Select table to aggregate data across all the data rows in the table. If you select table, select either header or footer as the location in which to display the aggregate data.
Select group to aggregate data at the group level. If you select group, select either header or footer as the location in which to display the aggregate data.
5 In Enter Label, type the text to display next to the aggregate value. By default, Report Studio uses the name of the function you selected. You can, for example, replace Max with the following text:
Highest value
6 If you want to calculate and display a second aggregation, choose Add Aggregation. Repeat steps 3 to 5 to define the next aggregation.
7 Choose OK. Figure 10‑2 shows the three aggregations that are defined for the BIRT design in Figure 10‑1.
Formatting aggregate values
Using Report Studio, you can format aggregate values in the following ways:
Specify alignment properties.
Modify font type, size, color, and style.
Apply a format to the aggregate values.
Filtering aggregate values
You can use filters to display aggregate values according to certain conditions. Because Report Studio displays only a preview of the actual data, when you perform actions such as aggregating data, or filtering aggregate data values, the resulting BIRT design displays different results in Report Studio and in Actuate Viewer. Report Studio applies the specified aggregation function or filter condition to the previewed data. Always view the BIRT design in Actuate Viewer to verify that the results are what you expect.
When you create a filter condition that excludes certain values, such as viewing transactions that closed over a month ago or listing products that are not the top five selling products, Report Studio recalculates the aggregate data according to the data Report Studio retrieves. In some cases, it is also useful to view aggregate values for the unfiltered data, for example, to perform percentage calculations on this data. To address both situations in detail tables containing aggregate data, Report Studio provides an option in the Filter, Advanced Filter, and Top/Bottom N filter dialog boxes to specify whether to recalculate aggregate data based on the filter condition created, or not.
How to filter aggregate values
1 In Report Studio, select and right-click the aggregate value. Choose Filter➛Filter, or Filter➛Filter Top/Bottom N.
2 Define a filter condition.
Report Studio evaluates the condition, and displays the resulting data in the BIRT design.
3 Run the report in Actuate Viewer to verify that the results are what you expect.