In Report Studio, complete the following tasks to create a cross tab:
Select data for the cross tab.
Lay out the cross tab.
Specify display options for the aggregate values.
Sometimes data objects created in BIRT Designer Professional contain links to enable users to drill through the data hierarchy in the data object to view either summary or detail information. For example, consider data organized in years, in a quarter‑month‑week hierarchy. If the data object contains defined hyperlinks for this hierarchy, choosing a year displays the quarters that make up the year, choosing a quarter displays the months in the quarter, and so on.
Selecting data for a cross tab
When building a cross tab, you group the aggregate data by at least two dimensions. To create the cross tab, one dimension is inserted in the row area, and one dimension (Productline) is inserted in the column area.
Each additional dimension by which you group data appears as a column or row, and provides a more comprehensive and detailed view of the data. If you calculate aggregate data by too many dimensions, the resulting cross tab can display several empty cells, causing a problem known as data sparsity. Additionally, a cross tab that contains more than two or three dimensions in either the row or column area is difficult to read. Avoid these problems by dividing the data into multiple cross tabs, enabling users to understand the data more quickly and easily.
How to select data for a cross tab
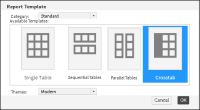
1 In Report Studio, choose New. Report Template appears.
2 In Report Template, complete the following steps:
1 In Category, select Standard from the drop-down list.
2 In Available Templates, select Crosstab, as shown in Figure 5‑2.
Figure 5‑2 Choosing the cross tab template
3 In Themes, select a theme from the drop-down list if your cross tab template contains associated themes.
Choose OK. Crosstab Builder—Data appears.
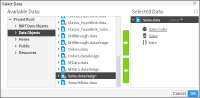
3 In Use Data From, choose New Data.
Select Data appears as shown in Figure 5‑3, displaying the available data objects. If you use customized data objects, ensure that they are placed in the /Resources folder of the BIRT iHub volume.
4 In Available Data, select a data object design or data object store file containing a cube or a data model. Then, choose the right arrow.
The data object appears in Selected Data, as shown in Figure 5‑3. Choose OK. To modify your selection, in Selected Data, select the data object and choose the left arrow. Then, repeat step 4.
Crosstab Builder—Data displays the data from the cube or data model.