This section provides step‑by‑step instructions for creating a simple BIRT design that lists customers and their contact information. The design uses a standard template and a sample BIRT data object data source, included in the standard BIRT iHub installation.
In this tutorial, you perform the following tasks:
Start Report Studio.
Select a template and a data source.
Select the data to display in the BIRT design.
Limit the data displayed.
Sort data in a meaningful order.
Format the data in the BIRT design to enhance its appearance.
Save and view the BIRT design.
Task 1: Starting Report Studio
To access Report Studio contact your system administrator to obtain the URL to access BIRT iHub and login credentials.
1 Log in to BIRT iHub.
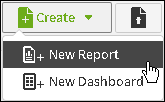
2 The landing page appears, listing the files and folders you can access in the volume. Choose Create➛New Report to launch Report Studio, as shown in Figure 1‑2.
Figure 1‑2 Launching Report Studio from an application
[\GS_DocumentsPage_new.png]
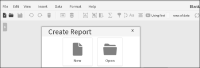
Report Studio launches in a web browser, as shown in Figure 1‑3, providing the option to either create a new design or open an existing design. In this tutorial, you create a new BIRT design.
Figure 1‑3 Opening an existing report or creating a new one in Report Studio
[\GS_BRSReportPrompt.png]
3 Choose New to create a new BIRT design. Report Template appears. A series of dialog boxes guides you through the report creation process.
Task 2: Selecting a template and a data source
Report Studio provides sample templates and data sources to enable you to create a variety of reports. In this task, you select the standard single table template to create a simple listing report, and the sample data object data source located in the BIRT iHub volume.
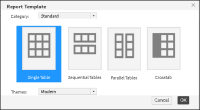
In Report Template, perform the following tasks, as shown in Figure 1‑4:
1 In Category, if necessary, select Standard.
2 If necessary, select Single Table, as shown in Figure 1‑4.
Figure 1‑4 Selecting a template
[\GS_Select_template.png]
3 In Themes, if necessary, select Modern. Choose OK.
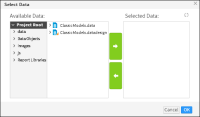
4 In Select Data, select Project Root, as shown in Figure 1‑5.
Figure 1‑5 Selecting a data source
[\GS_select_data.png]
5 In Available Data, select ClassicModels.data. Choose the right arrow. The selected data object appears in Selected Data. Choose OK.
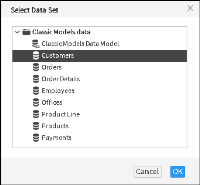
6 In Select Data Set, as shown in Figure 1‑6, select Customers. Choose OK.
Figure 1‑6 Selecting a data set
[\GS_select_data_set.png]
Table Builder appears displaying the data fields in the BIRT data object data source you selected.
[\GS_select_data_set.png]
Task 3: Selecting the data to display
In this task, you use Table Builder to select data fields to use in your new BIRT design.
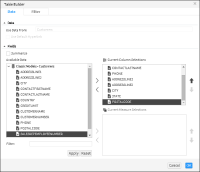
In Table Builder, shown in Figure 1‑7, complete the following steps:
1 In Data, in Use Data From, if necessary, select the Customers data object.
Figure 1‑7 Current Column Selections displaying the selected data fields
[\BRS_table_builder_data_selected.png]
2 If necessary, deselect Use Default Hyperlink.
This option appears highlighted when the data set you are using contains hyperlinks to other sections in a BIRT design, other BIRT designs in your iHub volume, or external URLs.
3 In Fields, if necessary, deselect Summarize, to create a detail table.
You select Summarize when you want to create a summary table that displays only aggregate data.
4 In Available Data, press Ctrl, and select the following data fields from the list, then choose the right arrow:
CUSTOMERNAME
CUSTOMERNUMBER
CREDITLIMIT
CONTACTFIRSTNAME
CONTACTLASTNAME
PHONE
ADDRESSLINE1
CITY
STATE
POSTALCODE
The selected data fields appear in Current Column Selections, as shown in Figure 1‑7. You can modify the order of data fields by using the up and down arrows in Table Builder—Data.
[\BRS_table_builder_dataselected_new.gif]
If the data source contains a large number of data fields, search for a data field by name or using a string. Type the name of the field or the string in Filter, then choose Apply. You can use the wildcard character (*) if you are using a string. If the data field is found, Table Builder displays the data field, and the category containing the data field in Available Data. Select the field and use the right arrow to use the data field in the BIRT design.
Task 4: Limiting the data displayed
You can now specify a filter condition if you want to limit the data retrieved from the data set and displayed in the report. Using filters is useful when working with data sets that contain large amounts of data. You can use Table Builder—Filter to specify a filter at the data set level. The following example sets a filter condition such that only data for the country USA is retrieved from the data set.
1 In Table Builder, select Filter.
2 In Table Builder—Filter, choose Add Filter, shown in Figure 1‑8.
Figure 1‑8 Adding a filter condition at the data set level
[\GS_add_filter.png]
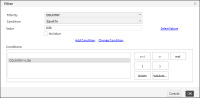
3 In Filter, complete the following steps:
1 In Filter By, select COUNTRY, the column to evaluate.
2 In Condition, if necessary, select the comparison operator, Equal to.
3 In Value, do one of the following:
Type USA.
Choose Select Values, then select USA from the list of values.
4 Choose Add Condition. The condition appears in Conditions, as shown in Figure 1‑9. Choose Validate. After a message appears confirming that the syntax of the filter condition is valid, choose OK.
Figure 1‑9 Specifying a filter condition
[\BRS_table_builder_filter.png]
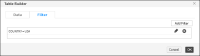
The filter condition appears in Table Builder—Filter, as shown in Figure 1‑10. Choose OK.
Figure 1‑10 Specifying a data set filter condition
[\BRS_table_builder_filter_new.png]
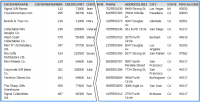
The data fields that meet the filter condition appear in the BIRT design, as shown in Figure 1‑11.
In this task, you improve the appearance and usability of the BIRT design by sorting data alphabetically by customer name.
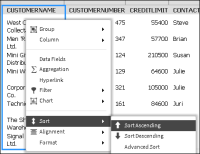
How to sort data
Select and right‑click the Customer Name column. Choose Sort➛Sort Ascending, as shown in Figure 1‑12.
Figure 1‑12 Selecting the sort option
GS_sorting.png
The BIRT design displays data arranged alphabetically by customer name.
Task 6: Formatting the BIRT document
In this task, you edit column labels and the report title. You hide visible report elements that you do not want to display in your BIRT design. When you create a new report from a template, all items in the template appear by default in the report. If you do not want an item, such as a report‑generation date or a label to appear in the report, you can hide the item. You also change the page layout to better fit the data in your report by using the following techniques:
Changing the layout type, page size, and orientation
Adjusting the widths of the columns
You also improve the presentation of the report by creating a new computed column to show the Contact first name and last name in a single column, formatting the Credit Limit column as currency in US dollars ($) and applying a custom string format to values in the Phone column.
How to edit a column label
1 Double-click the CUSTOMERNAME column label. Then, select the label and press Delete.
2 Type:
Customer Name
Then, press Enter.
3 Similarly, change the CUSTOMERNUMBER column label to Customer ID, CREDITLIMIT label to Credit Limit, PHONE label to Phone, the ADDRESSLINE1 label to Address, the CITY label to City, the STATE label to State, and the POSTALCODE label to Zip Code.
How to create a report title
1 Click the report title place holder. Then, select Report Title and press Delete.
2 Type:
Customer Directory
Then, press Enter.
The BIRT design now looks like the one shown in Figure 1‑13.
Figure 1‑13 Modifying column labels and the report title
How to select the items to hide or display
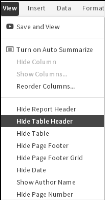
In this task, you hide the optional table header in the BIRT design.
Choose View➛Hide Table Header, as shown in Figure 1‑14. To hide additional editable items in the template, select the item from the list.
Figure 1‑14 Report items included in a template
[GS_ReportItems.png]
To select the items to display in the report, in the View menu, select each item to display from the list that appears.
How to set the layout type, page size, and orientation
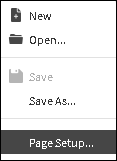
1 Choose File➛Page Setup, as shown in Figure 1‑15.
Figure 1‑15 Selecting the Page Setup option
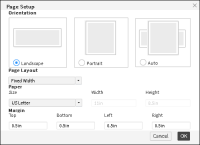
2 Set the following options, as shown in Figure 1‑16:
1 In Orientation, select Landscape, to accommodate the selected data columns on a standard page. When you choose Auto, Report Studio sets the page orientation depending on whether the report is longer or wider.
2 In Page Layout, select Fixed Width to set the page width and precise column widths yourself. You use the Auto Expand Width option to allow Report Studio to set column widths based on the other page options you select and on the number of columns in the table.
3 In Paper Size, if necessary, select US Letter.
4 In Margin, if necessary, set the size value to 0.5 inch, in Top, Bottom, Left, and Right.
Figure 1‑16 Specifying page setup options
Format_PageSetup.png
Choose OK.
How to set column widths
If you want to control precisely the widths of columns in a table, first set the Layout Preference property in Page Setup to Fixed Width. The option to set a column’s width is not available if the layout type is Auto Expand Width.
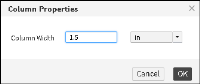
1 Select and right‑click the Customer Name column, then choose Column➛Column Width.
2 In Column Properties, as shown in Figure 1‑17, in Column Width, type:
1.5
3 In the next field, if necessary, select inches.
Figure 1‑17 Setting a column’s width using Column Properties
Choose OK.
[Format_ColWidth.png]
How to display first and last names in the same column
In this task, you create a computed column that concatenates values in two columns in a report design.
1 Select and right‑click the CONTACTFIRSTNAME column. Choose Column➛New Computed Column.
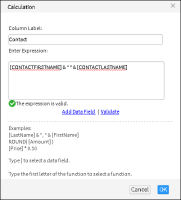
2 In Calculation, perform the following tasks:
1 In Column Label, type:
Contact
2 In Enter Expression, type [. Then, select CONTACTFIRSTNAME from the list that appears.
3 Type an ampersand (&), followed by a space enclosed in double quotation marks ('' ''), followed by another ampersand (&), and a left bracket ([).
4 Select CONTACTLASTNAME from the list that appears. The final expression is:
[CONTACTFIRSTNAME]&" "&[CONTACTLASTNAME]
5 Choose Validate to verify that there are no syntax errors in the expression. After a confirmation message appears, as shown in Figure 1‑18, choose OK.
The Contact column appears in the report design.
3 In the BIRT design, press Ctrl and select the CONTACTFIRSTNAME and CONTACTLASTNAME columns. Choose Delete. The columns no longer appear in the BIRT design.
Figure 1‑18 Creating a new column displaying contact first and last names
GS_calculation_dialog_box.png
How to format currency values
In this task, you format numeric data as currency in US dollars, with two decimal places.
1 Select and right‑click the Credit Limit column. Choose Format➛Format Data.
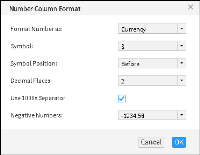
2 In Number Column Format, perform the following tasks, as shown in Figure 1‑19:
Figure 1‑19 Formatting currency values
GS_number_column_format.png
1 In Format Number as, choose Currency from the list.
2 Accept the default selection for each field listed in Table 1‑1.
Table 1‑1 Default selections for number column format
Field
Default selection
Symbol
$
Symbol Position
Before
Use 1000s Separator
Selected
Negative Numbers
-1234.56
3 In Decimal Places, select 2 from the list. Choose OK.
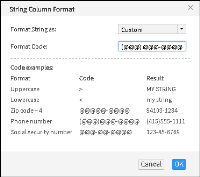
How to format a data string
You format string data as telephone numbers using a custom format code.
1 Select and right‑click the Phone column. Choose Format➛Format Data.
2 String Column Format appears. Complete the following steps:
Choose OK. All telephone numbers in the report design are formatted based on the specified format code.
3 Set the width of the Phone column to 1.25 inches to accommodate each phone number on a single row.
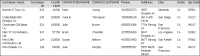
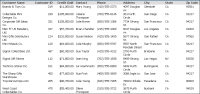
The BIRT design displays the formatted data columns, as shown in Figure 1‑21.
Figure 1‑21 Examining a formatted BIRT design
Task 7: Saving and viewing a BIRT design
You save a BIRT design to the home folder of your user account in the iHub volume. Your access privileges determine the folders in which you can save a report. Once the BIRT design is saved, Actuate Viewer displays the report with actual data.
How to save and view a BIRT design
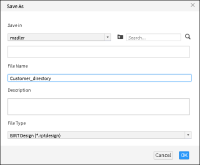
1 [BRS_Save_icon.png]Choose Save and View. The first time you save a BIRT design, Save As appears, as shown in Figure 1‑22. This dialog box typically displays your user’s home folder.
Figure 1‑22 Saving a report design
GS_SaveDialog.png
2 If necessary, navigate through the folder structure to select a different folder.
3 If you know the name of the existing file you want to overwrite, type the name or relevant keywords in Search. Then, press Enter, or choose Search. Save As displays the reports that match the string you provided.
4 In File Name, type:
Customer_directory
The file name can contain alphanumeric characters and spaces, but it cannot contain punctuation.
File Type shows that the report is saved as a BIRT report design file with a .rptdesign file‑name extension. Choose OK.
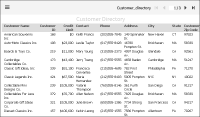
Actuate Viewer generates and displays the report, as shown in Figure 1‑23.
Figure 1‑23 Actuate Viewer displaying a completed BIRT design