When you lay out data in a cross tab, provide the following information:
In Dimensions, specify:
The grouped data fields to display as rows
The grouped data fields to display as columns
In Measures, specify the summary fields to display in the cross tab.
How to lay out data in a cross tab
1 In Crosstab Builder—Data, in Dimensions, in Available Data, select a grouped data field. To select multiple data fields, press Ctrl as you select each field.
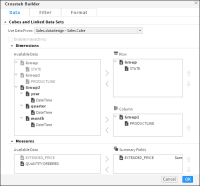
2 Choose the right arrow next to Row to set the selected field as a row, or choose the right arrow next to Column to set the selected field as a column. The example shown in Figure 5‑4 specifies State as a row, and Product Line as a column.
Figure 5‑4 Selecting data to display in the cross tab
3 In Measures, in Available Data, select a data field to aggregate, then choose the right arrow to set the selected field as a summary field. The example in Figure 5‑4 sets the Extended Price field as the summary field.
Choose OK. If the OK button is not visible in your web browser, select the up arrow in the Dimensions or Measures area until the OK button becomes accessible. The selected fields appear in a cross tab in Report Studio.