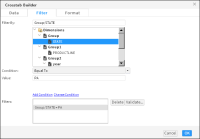
To display a subset of the available data in the cross tab, you can specify a filter condition for the cube or data model, as shown in Figure 5‑5.
Figure 5‑5 Specifying a data object filter
To create a filter at the data object level, choose Filter, and specify one or more filter conditions, as you would do for a BIRT report. For example, to view data only for Pennsylvania (PA), create a filter on the state dimension using the Equal To operator, as shown in Figure 5‑5.
The cross tab displays aggregate extended price data by product line, for only the state of Pennsylvania, as shown in Figure 5‑6.
Figure 5‑6 A cross tab displaying filtered data rows
You can also select the In operator in Condition to set a filter condition for more than one value. For example, you can define a filter condition that displays data for Pennsylvania (PA), California (CA), and Massachusetts (MA) in the cross tab.