Format a BIRT design to improve the appearance of the report. Common formatting tasks include providing a report title, modifying column labels, formatting column data such as setting font properties and alignment, setting standard or custom data formats, and merging data from several columns in a data source to present it in a single field in the BIRT design, where required. You can also specify page layout properties and adjust column width to enable your BIRT design to accommodate the selected data whether viewed online or in PDF format.
Labels contain static text. In a typical template, some labels are editable, and others are not. Examples of labels you can edit include report titles or author names. Examples of non‑editable labels include standard copyright or confidentiality statements.
When you insert data fields in a table, Report Studio displays the values in rows and columns and creates labels, or column headers that show the names of the data fields. These names are appropriate in a database, but usually are not suitable for a report. You typically edit the text in these column headers.
Report Studio also supports several standard and custom formats you can specify based on the type of data in a column. Sometimes data sources store data in multiple fields, when it makes logical sense to display this data in a single field in the BIRT design. For example, a contact name can be stored as two fields, first name and last name, but is easier to read when displayed in a single column in the BIRT design. Similarly, an address field can often be stored in several different fields, but is easier to read when viewed in a single field. In these cases, you can either use a computed column to combine the entries in each field into a new column, or merge multiple columns into a single field in the BIRT design.
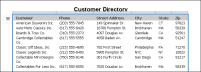
Report Studio presents data fields in a table. By default, the width of a table expands to accommodate all the selected data columns. This feature is typical for viewing a report online. Figure 1‑1 shows an example of a table that uses the default layout. The columns are approximately the same width, even though the data in the state and zip code columns, for example, occupy less space than the data in the Customer and Street Address columns. If you insert many data fields in a table, you can adjust the width of columns to improve the spacing between the columns.
Figure 1‑1 A BIRT design displaying data in the default table layout
To design a report that shows the same output when viewed online in HTML format or in a page‑based format such as PDF, set page properties for the design to modify layout type from Auto Expand Width to Fixed Width. Using the Fixed Width setting, you can specify a page width, and this value is reflected in the HTML web report, in the PDF version, and in the printed reports. If you use the default Auto Expand Width setting, the page size values can differ for the web report and the PDF or printed reports. The option to modify column width is not available if you use the default Auto Expand Width setting.
If you intend to print a report or export the report to a page‑based format, such as PDF or Word, check the report output in those formats to ensure that all the data fits on the page.
Saving and viewing a BIRT design
[BRS_saveandview_icon.gif]Report Studio provides a preview of the changes you make, as you create and modify a BIRT design. To view all the data, save and run the report. When you save a report in Report Studio, the BIRT design file with a .rptdesign file-name extension contains all the information necessary to generate the report. Choose Save and View. Your web browser displays the generated report in Actuate Viewer. As you modify a report, save and run the report periodically, and view the changes made in Actuate Viewer to make sure the result is what you expect.