Data groups contain related data rows. For example, you can create a report that lists items by category—all office furniture in one group, all computer hardware in another group, all computer software in a third group, and so on. Organizing data in groups makes it easier to compare and analyze information.
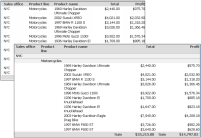
Compare the reports in Figure 9‑3. The BIRT design on the left shows the data in a simple list. The data rows are sorted by sales office, then by product line. The BIRT design on the right groups the rows by sales office then by product line. Data appears in a hierarchy without repeated values for office names and product lines. In addition, totals, displayed in italics, appear at the end of each product line and sales office group.
Figure 9‑3 A BIRT design displaying data grouped by sales office and product line
When you group data, you can:
Add subtotals, counts, averages, or other aggregate information at the beginning or end of each group.
Insert a page break before or after each group to start each group of data on a new page.
Hide the details of each group to view a summary report.
In addition, Report Studio completes the following actions when you group data:
Removes duplicate values.
Sorts the values of each group. For example, a product line group displays the product lines in alphabetical order (Classic Cars to Vintage Cars), as shown in Figure 9‑3.
Generates a table of contents when you view the finished report in Actuate Viewer. The table of contents, which displays the group values, supports navigating to specific locations in the report.
How to group data
1 Select and right‑click the column that contains the data to group.
2 Choose Group➛Add Group.
If the column you select contains string or numeric data, Report Studio groups the data by each unique value in the column. If the column you select contains date-and-time data, you have additional grouping options, described in the following section.
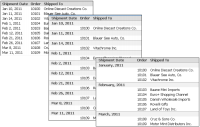
When you group data in a date-and-time column, you can show every individual date or time value, or you can group the data by a specific time interval. The second option is more typical. A shipping report, for example, can organize shipment data by month or by quarter, rather than by date.
Containing shipment dates grouped using individual values
Containing shipment dates grouped by month
Figure 9‑4 Comparing grouping options for date‑and‑time data
How to group date‑and‑time data
1 Select and right‑click the column that contains the date‑and‑time values to group.
2 Choose Group➛Add Group.
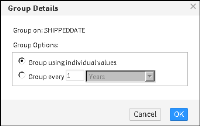
3 In Group Details, do one of the following:
Select Group using individual values.
Select Group every, and provide the following information:
Select an interval type, such as weeks, months, or quarters, from the drop‑down list.
Type a number by which to group the selected interval type. For example, if you selected Weeks, type 2 to group data in two‑week periods.
Figure 9‑5 shows grouping the SHIPPEDDATE column by month.
Figure 9‑5 Grouping dates by month
Consider order of precedence before creating multiple groups. To group customer data by state, then by city, create the groups in that order. The first group appears as the first column in the table, the second group appears next to it, and so on.
Changing the grouping order
You can also change the grouping order once you create groups in a BIRT design.
How to change the grouping order
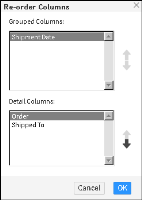
1 Select and right‑click any column. Then choose Column➛Reorder Columns. Reorder Columns, shown in Figure 9‑6, displays the grouped columns in the order in which the BIRT design currently groups the data.
Figure 9‑6 Changing the grouping order
2 In Grouped Columns, select a column and use the up or down arrows to move the column up or down the list. Choose OK.
Deleting a group
Deleting a group deletes all information associated with the group. For example, if the BIRT design displays aggregate data at the group level, this data is removed.
How to delete a group
To re-display the values in the detail row, delete a group. Select and right‑click the column whose values you want to ungroup. Choose Group➛Delete Group.