You can also organize report data into sections. A section is functionally equivalent to a group. When you create a section, you are also grouping data. Like groups, you can create multiple sections, calculate aggregate data for each section, start each section on a new page, and hide the details of each section.
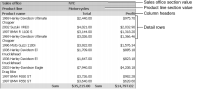
One primary difference between a section and a group is how the information is arranged. In Figure 9‑7, which shows a BIRT design with sections, the sales office and product line values appear above the column headers.
Figure 9‑7 Using sections to organize data
Organizing data in sections reduces the overall width of the table.
You can insert multiple charts, one in each section, to reflect the aggregated data in each section. In a table that contains data groups, you can display only one chart, which presents the aggregated data for the overall table.
You can display additional data fields in a section heading. By default, a section heading displays only a label and the section value, as shown in the BIRT design in Figure 9‑7. The data fields being used in the table are the ones available for addition to a section heading.
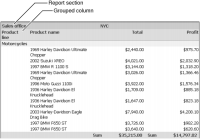
You can use both groups and sections in a single BIRT design. Figure 9‑8 shows a BIRT design that contains the same data as the previous examples, except the sales office column is a section, and the product line column is a group. If a column contains date‑and‑time data, you can create sections based on individual date values, or you can create sections that group dates by interval.
Figure 9‑8 Using a group and a section to organize data
How to create a section
1 Select the column that contains the data you want to organize in a section.
2 Choose Group➛Add Section.
How to add content to a section heading
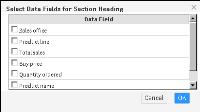
1 Select and right‑click the section heading. Choose Section Heading. A dialog box displays a list of the data fields that are in the BIRT design.
2 Select the data field to add to the section heading, as shown in Figure 9‑9.
Figure 9‑9 Selecting data fields to add to a section heading
3 Choose OK. The data field appears in the section heading.
If you do not see a data field you want to use, add it to the table so that it is available in the Data Field dialog box.
How to delete a section
You can delete a section to reorganize data. When you delete a section, the values in the section do not reappear in the detail rows. Instead, the values appear in a grouped column. Any aggregate data for the section is deleted. Any chart you inserted in the section is also deleted.
To delete a section, select and right‑click the section heading, then choose Group➛Delete Section.