A summary table presents aggregate data information in a report, providing users with a concise view of the data. The aggregate calculation occurs at the data source level, which enables users to quickly view summary information at a glance, improving response time and reducing the load on the server.
For example, from a data source that contains two fields—Order Status and Amount—using a summary table, the user can view the total amount for each status. Report Studio calculates the sum of the Amount field at the data source level, and presents the corresponding values in the BIRT design. This section describes how you can use Report Studio to create and modify a summary table.
Understanding columns in a summary table
In a summary table dimension columns group data in other columns. Some examples of dimension columns include order date, country, state, or product line. Dimension columns containing date‑and‑time data can be grouped in intervals, in a summary table. Measure columns contain the aggregated values that are evaluated. Depending on the type of data in a measure column, Report Studio makes available specific aggregate functions to use on the column. Some examples of measure columns include quantity ordered, profit, and revenue. Columns that provide additional information about a dimension field are called attribute columns. For example, a product name or product code data field can be attributes of the Product Line dimension. Each dimension can contain several attribute fields.
Designing a summary table
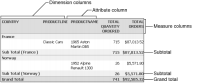
When you design a summary table, first evaluate which dimension, attribute, and measure columns you need, based on the aggregate data you want to display. In the example shown in Figure 4‑1, data in the measure columns is grouped by the dimension, and displays subtotals in the group footer. Although there are two dimension columns in the example in Figure 4‑1, the outermost one groups data in the other columns. The Product Name field is an attribute of the Product Line dimension. You can perform multiple aggregate calculations for data in a single measure column. A grand total is displayed in the report table footer.
Figure 4‑1 Example of a summary table
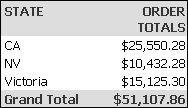
Although each attribute column must be associated with a dimension column for it to be useful in a summary table, you do not need a dimension column to create a meaningful summary table. The example shown in Figure 4‑2 displays order totals, the measure column, for each state, an attribute column, and a grand total for all states.
Figure 4‑2 Summary table without groups displaying the grand total
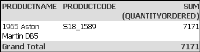
The example shown in Figure 4‑3 displays the grand total for two peer attribute columns and a measure column. Product code and Product name are peer attribute fields of the Product Line dimension field.
Figure 4‑3 Grand totals displayed for attribute columns
Because the example uses peer attribute columns, and the summary table does not contain the dimension field they are associated with, data is not grouped and subtotals are not displayed.