Using Report Studio, you can work with summary tables to format data, organize data in groups, sort data, create filters, and insert charts as you would for a detail table. This section describes the actions you can perform on dimension columns, attribute columns, measure columns, and each column header. Table 4‑1 lists the actions you can perform on dimension columns, measure columns, attribute columns, column headers, and the entire report table.
Table 4‑1 Modifying data in a summary table
Action
Dimension column
Attribute column
Measure column
Column header
Report table
Advanced filtering
✓
Advanced sorting
✓
✓
✓
Creating a new computed column
✓
Creating aggregate data
✓
Creating borders
✓
✓
Creating data set filters
✓
Creating filters
✓
✓
✓
✓
Creating groups
✓
Creating hyperlinks
✓
✓
✓
Creating page breaks before or after a group
✓
Creating sections
Deleting a group
✓
Deleting the column
✓
✓
✓
Disabling default hyperlinks
✓
Editing the column header text
✓
Filtering top/bottom N
✓
Formatting data
✓
✓
✓
Grouping date‑and‑time data in intervals
✓
Hiding a column
Hiding details for a group
✓
Inserting a chart
✓
✓
Reordering columns
✓
✓
✓
Sorting column data
✓
✓
✓
✓
Specifying alignment properties
✓
✓
✓
✓
✓
Specifying column width
✓
✓
✓
Specifying conditional formatting rules
✓
Specifying font properties
✓
✓
✓
✓
✓
When creating filter conditions for a summary table that uses a data model in a BIRT data object as the data source, the following conditions apply:
You cannot use Advanced Filter to filter data in a measure column.
You cannot use Advanced Filter to filter data in dimension and attribute columns if the summary table already contains a measure column with a defined filter condition.
You can use Advanced Filter to create filters for dimension and attribute columns in a summary table using a data model data source, if no filter condition is defined on a measure column.
Modifying the report table
You can perform the following actions at the report table level in a summary table:
Insert a chart at the report table level.
Hide a table, and display the corresponding chart.
Sort data.
Specify font properties.
Specify alignment properties for column data.
Format data types.
Add a border for the table.
Add data fields from the data set.
Reorder columns.
Create a bookmark to the summary table.
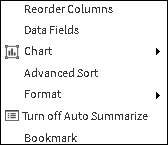
To add a table border, add data fields, insert a chart, reorder columns, or create a bookmark to the summary table, choose an option from the context menu of the report table, as shown in Figure 4‑7.
Figure 4‑7 Modifying the report table using the context menu
Modifying labels
You can perform the following actions on a column header or an aggregate label in a summary table:
Edit the header or label text.
Modify the alignment of label text.
Format font properties.
Create a border for the label.
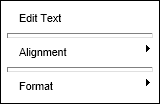
To modify a column header or an aggregation label, select the column header and choose an option from the context menu. The context menu appears, as shown in Figure 4‑8.
Figure 4‑8 Modifying a column header using the context menu