A crosstab is an analysis tool that allows you to cross different data fields either from within the same database table or different tables. For example, a sales manager can easily cross a “processed orders” field with a “type of articles” field to obtain (after adding calculated measures), the average profits generated or the sum of the purchase amounts, etc. The results are displayed as both dynamic tables and graphics. See practical, hands-on examples in “Sample procedures for creating crosstabs.”
Understanding Crosstabs
A dimension is an axis of the Crosstab -- i.e. one of the fields which is to be crossed with another field to provide an analysis of their data. When building a basic Crosstab analysis, you choose the database column or columns to be used as a dimension by dragging them into the row field and applying measures and filters.
It is also possible to pivot a Crosstab analysis by dragging the database column (to be used as a pivot) into the column field. This defines a special second dimension for the analysis, populating both X and Y axes - the first dimension “X” determined by a row(s) and the other dimension “Y” determined by the chosen pivot column. Pivoted results are presented according to the crossing of the values of the pivot column with the discrete values of the dimension rows and any applied measures and filters.
The discrete values in a database column that you choose to define as a dimension variable in your Crosstab are used as labels for dimension rows in the analysis. Options are made available for editing or clearing a discrete value by clicking on its corresponding dimension variable.
When dimension rows are created, cell values are automatically calculated for them through the application of a default measure (with a “count” operator) based on the database table that contains the chosen column. A Crosstab analysis must have at least one measure. (Otherwise no calculation operations can be done). When building your analysis you create/change measures to suit your needs.
Crosstab window environment
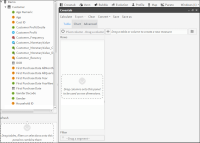
Before starting, you need to understand the Crosstab window environment. Clicking on “Crosstab” in the main “Analysis” tool window opens the Crosstab “Table” view where you build your Crosstab analysis. Its panels display basic information on how to start using the window immediately. You can build a simple Crosstab analysis directly in this window, in a few seconds, by simply dragging and dropping your chosen fields (columns) from the Data Tree on the left into the corresponding fields and panels. (See Figure 4‑1.)
Figure 4‑1 Crosstab Table view with explanatory panels
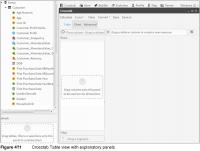
The main panel on the right will then display a column for each of your chosen fields and a final one for the calculated results. The column rows are labeled with the discrete values from your chosen dimension rows. (See Figure 4‑2).
Figure 4‑2 Table view of simple Crosstab analysis
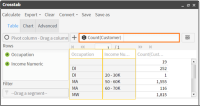
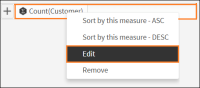
In Figure 4‑2, we also see that a default measure, “Count(Customer)”, has been automatically created when the first dimension was set. It appears in the “Measure” field near the top of the window. A Crosstab analysis must contain at least one measure before any calculation can occur. Clicking on a measure gives you access to an edit option. See Figure 4‑3.
Figure 4‑3 Measure options
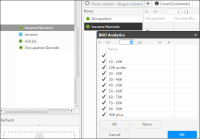
You can also edit the discrete values to be displayed by double-clicking on your chosen rows in the Rows panel. (See Figure 4‑4).
Figure 4‑4 Editing discrete values in chosen dimension rows
Your results appeared automatically in the right-hand column as soon as you dragged your dimensions into their designated fields. This happens because “Autocalculate” is the default setting.
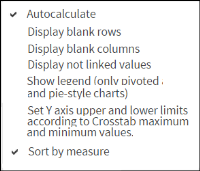
Note: Clicking on the “Quick Options”icon in the main Crosstab window gives access to several options when building a Crosstab analysis. They include, among others, the “Autocaclculate” and the “Sort by measure” options. You can save time by turning off the “Autocalculate” option when building a high volume analysis with multiple rows. (See Figure 4‑5).
Figure 4‑5 Quick Options list
Using the main viewing tabs in the Crosstab window
In order to be able to take full advantage of this tool, you also need to understand the usage of the Crosstab window view tabs “Table”, “Chart” and “Advanced”.
Table View
This is the default tab that opens when you click on “Crosstab” in the Analytics window (see figure 4.a at the beginning of this chapter). This tab provides you with an area for defining your dimensions (rows and pivot column) and for adding measures and filters. You simply drag and drop them into the corresponding fields.
At least one measure must be defined in order to produce an output. The first dimension that you drag into a field sets a “Count” measure for the table to which the dimension belongs.
Chart View
This tab displays a graphic representation of your numeric results. Clicking on a chart section lets you send the specific selection information to the Scratchpad. Both Doughnut and Pie charts can be rotated by maintaining a click on them and dragging in the direction you want the chart to rotate.
To choose the type of chart you want displayed, click on the “Chart” icon.
You can export your chart as an image file by clicking on the “Image” icon.
To save it as a PDF file, Click on the “Export” icon.
Clicking on the “Advanced” view tab opens the “Measures” tab by default. Here you have access to three other tabs: Filters, Parametric filters and Options.
Reminder: A measure is an operation that you choose to execute on the values that match the crossing of the fields in the rows and columns. As soon as you choose a field as an axis (setting a dimension or choosing a pivot column), our tool creates a measure using “Count” as the default operator.
Measures Tab
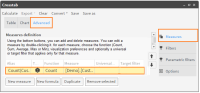
The “Measures” tab is used for advanced editing/creation and perfecting of the measures used in your Crosstab analysis. Upon opening this tab, you see a table of all the measures that have been set for the current Crosstab. You are also provided with brief instructions for defining measures in this tab. (See Figure 4‑6).
Figure 4‑6 Crosstab Advanced Measures tab
Double -clicking on a measure in the Advanced tab opens it in the Measure Creation window, populated with the measure information, ready to be edited. The buttons at the bottom of the Advanced “Measures” tab offer four useful operations that can be performed when creating measures, as shown in Figure 4‑7.
Figure 4‑7 Advanced Measures operations
New Measure Button
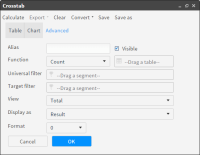
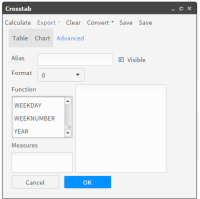
This button opens a window designed to help you build a new measure (See figure 4.7 below). In this window you can:
Name your measure in the “Alias” field (mandatory).
Choose your basic measure operation from the dropdown list in the functions field: Count, Sum, Average, Max or Min.
Specify the field or table that will be operated on by dragging it from the Data Tree into the “Table” field beside the “Function” field.
Decide what you want displayed using the dropdown list in the “Display as” field: Result, Diff., Index.
Decide how you want the results displayed using the dropdown list in the “View” field: Total, %Total, %Row and %Column.
Check or uncheck the “Visible” checkbox, depending on whether or not you want to display the results of your measure calculation in the “Table” view.
Decide the number of decimal points to display using the dropdown list in the “Format” field.
Add universal and target filters if required. Normally, you should only filter the measure by a specific category or segment (ie. specific group of customers, territory, type of product, etc.).
Save your new measure and go back to the Advanced “measure” tab by clicking “OK”. (See Figure 4‑8.)
Figure 4‑8 New Measure window in Crosstab
New Formula Button
This button gives access to a window where you can create more complex calculated measures, based on the simple ones that you have already created.
Example: You could use the sum of the cost of company operations, divided by the number of operations carried out in order to obtain an approximation of company costs per type of operation.
In the “New Formula” window (shown below in figure 4.8) you can:
Name your measure in the “Alias” field (mandatory).
Check or uncheck the “Visible” checkbox, depending on whether or not you want to display the results of your measure calculation in the “Table” view.
Decide the number of decimal points to display using the dropdown list in the “Format” field.
Choose the measure you want to operate on by clicking on it in the “Measures” panel on the left. (All measures that have been defined for this analysis will appear in this panel when you open the “New formula” window).
Choose the advanced measures operation to be added to an existing operation from the sliding list in the functions (operators) field. All standard expressions and operations are available such as:
Date and time functions (daysto, age, year, month, secsto, time, datetime...)
Time functions (...)
Text functions (left, right, mid, replace...)
Data type conversion (date, string, integer)
Build complex operations in the main workspace on the right.
Save your new measure formula by clicking “OK”. This also closes the “New formula” window. Click on it again if you have more new operations to add to your measure(s). (See Figure 4‑9).
Figure 4‑9 New Formula window
Note: When two integers are divided, the result value is also and integer. If a real result is required, a real number should be used as a dividend or divisor. For example:
100.0/3
100/3.0
real (100)/3
Duplicate Button
This button makes it possible to create a new measure based on an existing one (selected from the list of measures that appear in the Advanced “Measures” tab. It opens the “New measures” screen with its fields already populated with information concerning the selected measure. Enter the name for the new measure in the “Alias” field.
“Remove selected” Button
Just as its name indicates, this button lets you remove a selected measure from the Crosstab analysis.
Filters Tab
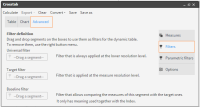
This tab opens a window used for applying filters to your analysis. Three types of filters are available: Universal, Target and Baseline.
You can also easily apply a filter to your analysis directly in the main Crosstab workspace by simply dragging and dropping a filter segment directly into the “Filter” field below the “rows” panel. For multiple or more complex filter additions, you need to use the Filters tab. (See Figure 4‑10).
Figure 4‑10 Filters tab in the Crosstab Advanced window
Using Filters
Filters are used throughout BIRT Analytics and are based on data segments. Choosing to use a Universal, Target or Baseline filter will depend on the situation. A Universal filter is applied to a non-pivoted analysis before any change of resolution occurs, whereas a Target filter is applied to a pivoted analysis after a change in resolution occurs.
Target and Baseline filters are used together to create comparative analyses. You must, of course, use segments that can be compared, such as comparing one year with another year or comparing one population group with another.
Understanding resolution change in Crosstabs
When building a Crosstab analysis requiring a change in resolution between dimensions (axes) and the measures in the direction N-to-1, intersection (or crossing) can take place in two different ways:
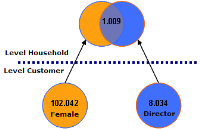
Type 1 (pivoted): with one variable in Rows and another one in Columns and with resolutions calculated separately before intersection takes place, as shown in Figure 4‑11.
Figure 4‑11 Pivoted crosstab intersection
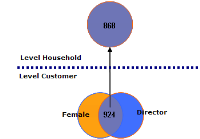
Type 2 (all fields in rows): with 1 or more variables in Lines and none in columns and where intersection takes place before uploading the resolution, as shown in Figure 4‑12.
Figure 4‑12 All fields in rows intersection
Parametric Filters Tab
This tab makes it possible to apply filters based on interactive selection of parameters when creating a Crosstab. The User interacts directly with the analysis during calculation by supplying values when prompted. Values in normal filters are pre-set before calculation, with no interaction possible.
Note: You can choose to use either a pre-set filter or a prompted parametric filter when cross tabulating, but you cannot use both.
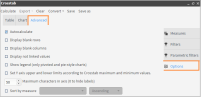
Options Tab
The Options tab gives access to several different possibilities for building or displaying your analyses. Most are self-explanatory. The Autocalculate feature is selected by default. You will often need to turn it off. (See Figure 4‑13).
Figure 4‑13 Options tab in the Crosstab Advanced view