How to display totals and subtotals
1 Choose Totals.
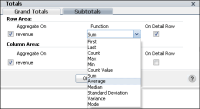
2 In Totals—Grand Totals:

From the available measures in Row Area and Column Area, in Aggregate On, select the measures for which to display grand totals.
For each selected measure, in Function, choose a function from the list to calculate the grand total, as shown in
Figure 4‑5.
Specify one of the following ways to calculate cross tab grand totals:
If you deselect On Detail Row, Data Analyzer uses the cross tab display values to calculate grand totals.
If you select On Detail Row, Data Analyzer uses the detail row values in the data source to calculate grand totals.
Figure 4‑5 Choosing a function to apply to a grand total
Choose Subtotals.
3 In Totals—Subtotals:
From the measures in Row Area and Column Area, in Aggregate On, select measures for which to display subtotals.
In Function, for each selected measure, choose a function from the list to calculate the subtotal.
Specify one of the following ways to calculate cross tab subtotals:
If you deselect On Detail Row, Data Analyzer uses the cross tab display values to calculate subtotals.
If you select On Detail Row, Data Analyzer uses the detail row values in the data source to calculate subtotals.
Choose OK.
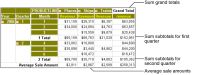
Data Analyzer displays the specified grand totals and subtotals. For example,
Figure 4‑6 displays the average sale amounts, based on detail rows in the data source, in the Average Sale Amount row, and the sum grand totals in the Grand Total column. Also, the figure displays first‑quarter and second-quarter subtotals in the Planes, Ships, and Trains columns.
Figure 4‑6 Displaying subtotals, averages, and grand totals