How to insert a chart
To insert a chart in the report, complete the following tasks:

To insert a chart at the table level, select the table, then choose Chart, and select a chart technology.
To insert a chart at the table header level, select a column header in the table header row, then choose Chart, and select a chart technology. If your report design contains sections, selecting a column header does not enable Chart on the toolbar. You must first delete the existing section or sections, select a column header and insert the chart, then recreate the section or sections.
To insert a chart at a section level, select the section heading, then choose Chart, and select a chart technology.
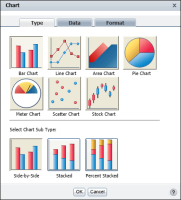
After you insert a chart, BIRT Studio displays the chart wizard, as shown in
Figure 8‑5. You use the chart editor to select a chart type, select data for the chart, and format the chart.
Figure 8‑5 The chart wizard displaying the Chart—Type page