Creating a Flash chart
In BIRT Studio, you can insert a Flash chart at the table level or section level, just as for regular charts. The procedure to create a Flash chart is similar to the one to create a standard chart. To create a Flash chart, perform the following steps:
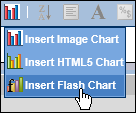
1 On BIRT Studio, select the report table, or report section, and choose Chart
➛Insert Flash Chart, as shown in
Figure 8‑81.
Figure 8‑81 Inserting a Flash chart
Flash Chart appears.
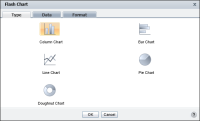
2 In Flash Chart—Type, select a chart type.
Figure 8‑82 shows the types of Flash charts available in BIRT Studio.
Figure 8‑82 Selecting the type of Flash chart
3 In Flash Chart—Data, specify the data to present in the chart, in the same way you did for a standard chart.
4 On Flash Chart—Format, specify the formatting properties for the chart. The available formatting options depend on the chart type, and are similar to the formatting options available for BIRT charts.
The following sections describe how to select data to display in a Flash chart, and how to format a Flash chart.