Selecting data for a Flash chart
The process to select data for a Flash chart is similar to the process to do so for a standard chart. When you select data for a column, line, or bar Flash chart, you specify the value series and the category series, if applicable. You then set the grouping options and select a value to display for the tooltip from the drop‑down list. When you select data for a pie or doughnut Flash chart, you specify the values to display as sectors of the pie or doughnut. You then specify the grouping options and select a value to display for the tooltip from the drop‑down list.
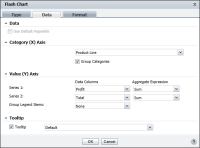
Flash Chart—Data, shown in
Figure 8‑83, displays an option, Use Default Hyperlink. This option is highlighted when you work with a chart that retrieves data from a data object containing predefined hyperlinks. When this field appears highlighted, you can specify whether to display or suppress default hyperlinks in the chart.
Figure 8‑83 Selecting data for a Flash chart