How to aggregate data
1 Select the column that contains the data to aggregate.
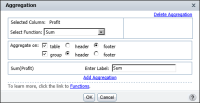
2 Choose Aggregation. Aggregation appears, as shown in
Figure 4‑24.
3 In Select Function, select the aggregate function to use.
4 In Aggregate on, do the following:

Select table to aggregate data across all the data rows in the table. If you select table, select either header or footer as the location in which to display the aggregate data.
Select group to aggregate data at the group level. If you select group, select either header or footer as the location in which to display the aggregate data.
Figure 4‑24 Creating an aggregation
5 In Enter Label, type the text to display next to the aggregate value. By default, BIRT Studio uses the name of the function you selected. You can, for example, replace Max with the following text:
Highest value
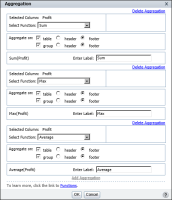
6 If you want to calculate and display a second aggregation, choose Add Aggregation. Follow steps
4 to
5 to define the next aggregation.
Figure 4‑25 Defining three aggregations