Formatting an HTML5 chart
As in a standard chart, the following formatting options are available for an HTML5 chart:

Specifying the chart title and size
Specifying a subtype when applicable
Displaying the chart using glass style
Displaying the legend and specifying its position
Specifying Category (X) axis properties
Specifying Value (Y) axis properties
In addition to the formatting properties that are available for BIRT charts, HTML5 charts provide the following additional options:
Specifying style properties for the chart by selecting a theme
Specifying an option for the user to view and analyze details in category or value axis data
Applying a chart theme
Themes provide a flexible way to define and maintain styles in one place and reuse them for any chart that you create. BIRT Studio provides several predefined themes for HTML5 charts. On the Format Chart page, Theme displays the theme currently being used by the chart, or None, if no theme is in use. To apply a theme or to modify an existing theme, select a theme from the drop-down list.
The charts shown in the following examples in
Figure 8‑93 and
Figure 8‑94 display two of several themes available in BIRT Studio. Using a theme provides a consistent style across different types of charts. For example, a theme that uses corporate styles might define general attributes, such as color schemes for the chart background and plot areas, font styles for chart titles, value labels, or axis labels, border styles, and legend styles.
Themes are designed by the report developer, who then makes them available to users.
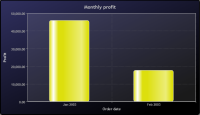
Figure 8‑93 shows a chart that uses the Chart Blue theme, while
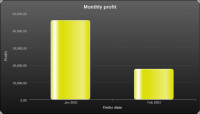
Figure 8‑94 shows the same chart using the Chart Gray theme. The chart in the example in
Figure 8‑92 uses the Chart Grid theme.
Figure 8‑93 Chart using the Chart Blue theme
Figure 8‑94 Chart using the Chart Gray theme
Examining details for axis data
BIRT Studio enables you to closely analyze sections of a chart using the zoom feature available in HTML5 charts. Select this feature to enable users to zoom into data presented as categories or values.
To use this feature, complete the following steps.
In Allow Zoom into, select:
Category (X) Axis to view details for data values on the
x‑axis
Value (Y) Axis to view details for data values on the
y‑axis
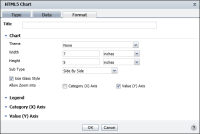
In the example shown in
Figure 8‑95, the Format page displays the option to zoom into a region on the Value (Y) axis.
Figure 8‑95 Zooming into data values to view details
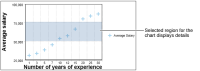
On the chart, use your mouse pointer to select the region on the Value (Y) axis for which you want to view details. The example in
Figure 8‑96 shows a selected region on the
y-axis. BIRT Studio displays detailed data in the chart, for the selected section. To view the entire chart once again, select Reset Zoom, which appears on the top right corner of the chart.
Figure 8‑96 Zooming into the Value (Y) axis to view details