Using a performance map gadget
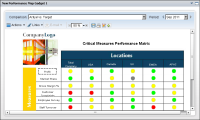
A performance map gadget displays a performance map on the dashboard. Maps are diagrams that show performance information and can link to other objects, such as a book or view.
Figure 3‑29 shows an example performance map gadget.
Figure 3‑29 Viewing a performance map gadget
When creating or editing a performance map gadget, you can select a map to display from available maps, as shown in
Figure 3‑30.
Figure 3‑30 Selecting a map to display in a performance map gadget
Users can open views, link, dashboards, and use the map toolbar to access additional options such as displaying a time period and comparing data. For more information about using maps, see User Guide for BIRT Performance Scorecard.
In New Performance Map Gadget—General you can specify options to customize the display of performance map gadgets. For more information about general options, see
Setting general gadget options, earlier in this section.


