About data visualization gadgets
Data visualization gadgets display data from BIRT data objects. Data visualization gadgets can link to data selection gadgets on the same dashboard to filter data based on user selection.
When a data version gadget is on a dashboard, users can select which version of a BIRT data store file is displayed in gadgets on the dashboard. For example, a data version gadget that displays Q1 2010, Q2 2010, Q3 2010, Q4 2010 enables the user to view data from any quarter of 2010 in the current dashboard.
The following gadgets are available in the data visualization category:

Chart gadget
A chart gadget displays data in a JavaScript-based chart. A user can filter, group, change chart types and aggregate data. Available chart types are area, bar, column, doughnut, line, pie and scatter. A chart gadget supports drill‑down when displaying cube-based data. When a chart displays a legend, you can filter data by selecting a legend value.
Figure 4‑27 shows a column chart.
Figure 4‑27 Reviewing a data set in a column chart

Cross tab gadget
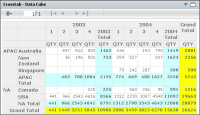
A cross tab gadget displays aggregated data in rows and columns. Users can analyze, filter, and download this data by opening the cross tab in the browser-based BIRT Data Analyzer tool.
Figure 4‑28 shows a cross tab gadget.
Figure 4‑28 Reviewing a data cube in a cross tab

Flash gadget
A Flash gadget displays data in an Adobe Flash-based visualization. Users can filter, group, and aggregate data. Available Flash gadget types are bullet, cylinder, linear gauge, meter, spark line, and thermometer.
Figure 4‑29 shows a linear gauge gadget.
Figure 4‑29 Reviewing a data set in a linear gauge

Flex table gadget
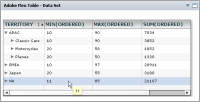
A Flex table gadget displays a data set in a row and column layout. Optionally, users can summarize this data with various aggregation options, filtering, and sorting. Gadget developers can change a Flex table from summary to detail without rebuilding the gadget.
Figure 4‑30 shows a Flex table gadget.
Figure 4‑30 Reviewing a data set in a Flex table

Table gadget
A table gadget displays a data set in a row and column layout.
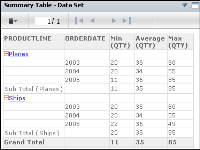
Optionally, use aggregation options, filtering, and sorting to summarize this data. The dashboard developer decides if a table gadget displays summary or detailed data when the gadget is created.
Figure 4‑31 shows a summary table.
Figure 4‑31 Reviewing a data set in a summarized table


