Zooming in to a chart
You can zoom in to a chart to see details of displayed data. Chart gadgets and charts in BIRT documents support zooming on the x-axis, y-axis, or both at the same time. Zoom is enabled by the BIRT dashboard developer.
To make an
x-axis zoom, select a start point on the
x-axis, drag the mouse to the end point, and then release the mouse button.
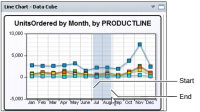
Figure 4‑67 shows an
x-axis zoom.
Figure 4‑67 Zooming on the x-axis
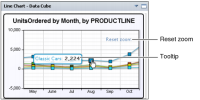
Figure 4‑68 shows the results of an
x-axis zoom. Choose Reset zoom to return the chart to the default display or continue to zoom to view additional detail.
Figure 4‑68 Finished zoom on the x-axis
To make a
y-axis zoom, select a start point on the
y-axis, drag the mouse to the end point, and then release the mouse button.
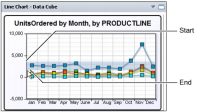
Figure 4‑69 shows a
y-axis zoom.
Figure 4‑69 Zooming on the y-axis
Figure 4‑70 shows the results of a
y-axis zoom. Choose Reset zoom to return the chart to the default display or continue to zoom to view additional detail.
Figure 4‑70 Finished zoom on the y-axis
To make an
x‑ and
y-axis zoom, select a beginning point on the
y-axis, drag the mouse to the end point on the
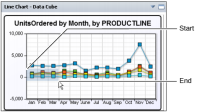
x-axis, and then release the mouse button. This creates a box around the points to zoom in to, as shown in
Figure 4‑71.
Figure 4‑71 Zooming on the x‑ and y‑axis
Figure 4‑72 shows the results of an
x‑ and
y‑axis zoom.
Figure 4‑72 Finished zoom on the x‑ and y‑axis
Choose Reset zoom to return the chart to the default display or zoom again to view additional detail.


