In a chart having depth or in a three-dimensional chart, you can specify how deep the chart bars stretch. For example,
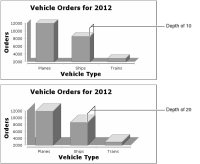
Figure 17‑39 compares different series depths for a two-dimensional bar chart with depth. The upper chart uses a series depth of 10 points. The lower chart uses a series depth of 20 points. The units of measurement, such as points, for the series depth match the units that appear in the chart. You can specify the depth of lines that appear in a two-dimensional with depth pie chart.