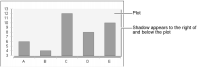
The default background color for the plot is transparent. You can also use a standard color, a custom color, a color gradient, or an image. Also, you can outline the plot and change the line color, style, and width. To highlight the plot area within the axes, you can use a shadow, similar to the one in
Figure 17‑59. You add a shadow by setting the Shadow option in Area Format.