You use anchor settings to modify where the plot appears within the chart and inset settings to determine how much padding appears between the plot and other chart features. You can use plot spacing settings to modify the space between the plot area and the chart axes. Plot spacing includes horizontal and vertical settings. For example,
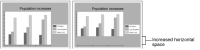
Figure 17‑60 shows the effect of increasing the horizontal spacing in a bar chart. In the second chart, the space between the horizontal axis and the bottom edge of the plot is much larger. To change the spacing around the plot, you set inset and spacing options in Area Format.