A marker displays a label to identify the axis point or range that the marker highlights. You can adjust the line style, width, and color of a marker line, or change the range fill color or outline of a marker range. You can also specify an image to be used as a marker on the chart. To format a marker line or range, use the formatting options shown in
Figure 17‑79 or
Figure 17‑80.
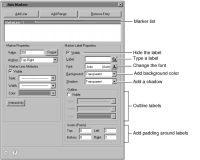
To hide or format a marker label, select a name from the marker list, then set the corresponding properties, as shown in
Figure 17‑81.