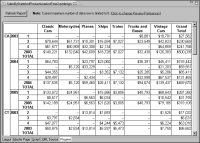
A cross tab displays one column or one row for each unique value in a field used as a dimension, if there is measure data to display. The cross tab in
Figure 18‑61 displays sales totals by product line, state, year, and quarter. Notice that these rows are missing: CA 2003 Q2, CA 2005 Q3, and CA 2005 Q4. The cross tab skips these rows because there is no sales data for those quarters.
You can add those missing rows, as the cross tab in
Figure 18‑63 shows. Similarly, you can also add missing columns. Add missing rows and columns to make it clear that there is no data for certain categories. In this example, displaying all the quarters also makes the data appear complete and consistent. Use this feature judiciously. Adding missing rows and columns can result in a cross tab that shows too many empty cells.