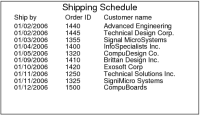
When you create a group, BIRT’s default behavior is to group data by a single value, such as a customer name, an order ID, or a date. In the detailed orders report shown in Figure 12‑8, each customer name starts a new group, and each order ID starts a new group within the customer group.
Sometimes, it is more useful to group data by a specific interval. A sales report, for example, can present sales by quarters, rather than by dates. Similarly, you can group data in a shipping report by weeks or months, rather than by dates.
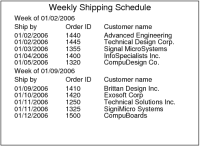
The report in Figure 12‑12 groups the same shipping information by weeks.
Figure 12‑12 Dates grouped into weekly intervals
As the reports show, grouping by interval provides the following benefits:
Organizes a long report into shorter, more readable pieces
Summarizes data further for more effective analysis
The following sections describe in more detail how to group date-and-time, numeric, and string data by intervals.
Grouping string data by intervals
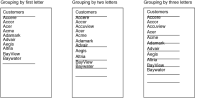
When grouping string data by interval, the interval you specify is a sequence of characters of a particular length. For example, if a customer group sorts customers by name, you can group customers by the first letter of their names, or the first two letters, or the first three letters, and so on. Figure 12‑13 shows the results of grouping names by the first letter, the first two letters, and the first three letters. Lines separate the groups.
Figure 12‑13 Results of grouping string data by intervals
Group by the first letter to group names by letters of the alphabet. In a customer list, for example, you might want to group all customers whose names begin with A under the heading A, all customers whose names begin with B under the heading B, and so on.
Group by multiple letters to group items whose names contain special prefixes for classification or categorization. A computer parts vendor, for example, might use the prefix ME for all memory chips, CP for CPU boards, MO for monitors, and so on. In this case, creating a computer parts list that groups names by the first two letters lends itself to logical groupings by part type.
2 Set the Interval field in the group editor to Prefix.
3 Set Range to the number of characters by which to group.
Grouping numeric data by intervals
When grouping numeric data by intervals, the interval you specify is a range of numbers. For example, if an order group sorts orders by numeric ID, you can group the orders by intervals of 10, 50, 100, 1000, and so on.
The interval that is best for any set of numeric data depends on the range of numeric values. If the numbers range from 100 to 200, it makes sense to group in intervals of 10. If the numbers range from 100 to 1000, you might want to group in intervals of 100.
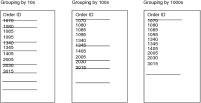
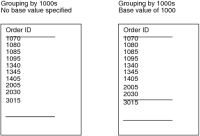
Figure 12‑14 shows the results of grouping numbers by intervals of 10, 100, and 1000. Lines separate the groups.
Figure 12‑14 Results of grouping numeric data by intervals
Groups are calculated from the first value in the data set. If the first number is 1070, and you use an interval of 10, the first group contains values from 1070 to 1079, the second group contains values from 1080 to 1089, and so on. In the example report that shows a grouping interval of 1000, the numbers 2005 and 2030 are not in a separate group, which is what you might expect, because the first group contains numbers from 1070 to 2069. The second group contains numbers from 2070 to 3069.
Rather than using the first data set value as the starting, or base, value for determining the grouping of numbers, you can specify a different base value to group numbers in more predictable ranges. Compare the two reports in Figure 12‑15.
Figure 12‑15 Results of grouping with and without a base value of 1000
A base value of 1000 provides better results than a base value of 1070 when grouping by intervals of 1000. Rather than grouping numbers in groups of 1070–2069 and 2070–3069, the second report uses more logical groups of 1000–1999 and 2000–2999.
2 Set the Interval field in the group editor to Interval.
3 Set Range to the desired grouping interval.
4 To specify a starting value to use for calculating groups, select Use fixed base value for interval, and specify a number.
Grouping date-and-time data by intervals
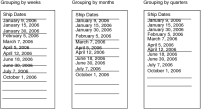
When grouping date-and-time data by intervals, you group data by time periods, such as hours, days, weeks, months, and so on. Grouping by time periods is useful for reports that display information that has a time or schedule focus, such as weekly shipping schedules or quarterly sales figures.
The reports in Figure 12‑16 show the results of grouping dates by weeks, months, and quarters. The lines separate the groups. By default, weekly groups start on Mondays, monthly groups start on the first date of the month, and quarterly groups are January 1–March 31, April 1–June 30, July 1–September 30, and October 1–December 31. If you group by year, the groups start on January 1 and end on December 31.
Figure 12‑16 Results of grouping date-and-time data by intervals
To use a value other than the default start value for date-and-time groups, specify a different base value to group dates in different ranges. For example, an organization’s fiscal year is October 1 to September 30. To group 10 years’ worth of data into groups by fiscal year rather than by calendar year, set the interval to month and the range to 12, then specify a base value such as 1995‑10. You must use the year-month format. The report displays the data in the following groups: October 1, 1995–September 30, 1996; October 1, 1996–September 30, 1997; October 1, 1997–September 30, 1998; and so on.
A base value should have the same granularity as that of the interval. As the previous example shows, if you set the interval to month, you specify a base value that includes the year and the month. If you set the interval to day, specify a base value that includes the year, month, and day.
2 Set the Interval field in the group editor to one of the time period values, such as Year, Month, Week, Day, or Hour.
3 Set Range to the number of units to include in each group. For example, if the selected interval is Week, specify 2 as the range to group data in two‑week periods.
4 To specify a different starting value to use for calculating groups, select Use fixed base value for interval, then specify a date.