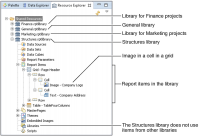
To add report elements and styles from a library to a report design, use the Resource Explorer view. Resource Explorer shows the elements in a library using the same tree structure as the Outline view. Figure 28‑14 shows an example of how elements in a library appear in Resource Explorer.
Figure 28‑14 Resource Explorer showing elements in a library
Understanding libraries in Resource Explorer
Resource Explorer is a source for elements in a report design. You place elements from a library into a report design and then customize them. You do not use Resource Explorer to change or create elements in a library.
Resource Explorer does not check actively for changes to libraries. To update Resource Explorer to display changes to the list of available libraries or the items in an individual library, right-click and choose Refresh.
Using library report elements
Use report elements from a library in the same way as items from the palette or data elements from Data Explorer. In Resource Explorer, expand a library and the slots in the library to see the items available. Next, drag a component from the library to the place where you need it in your report design.
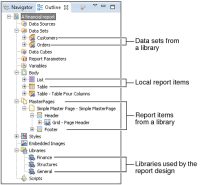
For example, to use a visual report item, expand Report Items inside the library. Then, drag the report item to the layout of your report design. BIRT Report Designer adds the library to the report design. The library and library items appear in the Outline view as icons with a link, as shown in Figure 28‑15. This illustration shows a report design using all three libraries shown in the Resource Explorer in Figure 28‑14. The Structures library provides the TableFourColumns item and the PageHeader grid used by the master page. The other libraries provide the data sets.
Figure 28‑15 Outline view showing report items from a library
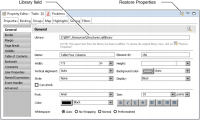
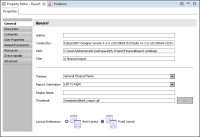
To identify the library defining an element, select the element in the layout or Outline view. Property Editor displays the field, Library, as shown in Figure 28‑16. This field shows the full path of the library that defines the element.
Figure 28‑16 Property Editor for a table element from a library
If a report item in the library is a structure, such as a grid, you must include the entire structure in your report design. You cannot select one piece of the structure, such as the image in a cell in a grid, shown in Figure 28‑14. For such an item to be available to a report design, the library must provide it as a separate item.
To add a data set from a library to a report design, drag the data set from Resource Explorer onto the Data Sets slot in the Outline view. The data set appears in Data Explorer as well as in the Outline view.
Understanding library name space
BIRT uses name space to identify the sets of report elements that each library contains. BIRT bases the name space on the file name of the library. For example, if the name of the library is FinanceProject.rptlibrary, the name space is FinanceProject. BIRT uses a separate name space for each library to support a report design using multiple libraries containing items of the same name. For example, if a grid named Page Header occurs in more than one library that the report design uses, BIRT uses the name space to select the one to display in the report.
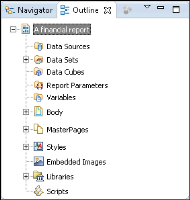
The name space appears in the Libraries node in the Outline view for the report design, as shown in Figure 28‑1, and in the names of themes and styles that the report design uses. The use of the name space in a style shows a report developer where the style is defined.
If a report design uses more than one library having the same file name space, BIRT Report Designer prompts for a name space for the second and subsequent libraries. In this case, provide a name space that distinguishes the library from the others but shows a relationship to the library’s file name.
Modifying a library-based element
An element from a library provides a base for report development. Typically, you modify some of the element’s properties when using a library element in a report design. For example, a report design contains many copies of a data item from a library. Each data item displays a different data value by using a different column binding.
Using dynamic library behavior
You modify a library-based report element in the same way as any other element in the report design. The report design stores only the changed properties. BIRT uses all other property values from the element in the library. In this way, BIRT both retains the dynamic nature of the library and supports local changes.
All properties of a simple report item, such as an image or text element, are changeable. For a library structure such as a table, column bindings and grouping are changeable, as are expressions and values in labels and other report items inside the structure, but not the structure itself. For example, you cannot add or remove columns or groups in a grid, list, or table element from a library. To hide columns or rows, set the width of a column to zero, or use the visibility properties to hide the element.
Discarding modifications to a library-based element
Development of a report design is an iterative process. In some cases, the initial modifications to an element from a library do not produce the required result. To revert to the original properties of an element from a library, select the Restore Properties button on Property Editor’s toolbar. Figure 28‑16 shows the location of this button. When you select this button, BIRT Report Designer prompts you to confirm that you want to discard your changes.
Using a library table having standardized data binding
A library table having standardized data binding is more straightforward to use than a table without standardized binding. The report developer sets aliases on columns in a data set before binding the data set to the table. Using the aliases binds the data columns to the data items in the table. Without standardized binding, the report developer must modify each data item in the table separately.
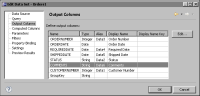
After adding the library table to a report design, check the position of each data item in the table. Then, edit the data set to bind to the table. Ensure that each alias matches the required location in the table. For example, in a table having a structure matching Figure 28‑13, the data fields in the group header bind to columns named Data1 and Data2. To display CUSTOMERNUMBER and STATUS columns in the group header, set the aliases to Data1 and Data2 respectively, as shown in Figure 28‑17.
Figure 28‑17 Data set using standardized aliases for output columns
After updating the data set, bind the data set to the table. BIRT updates the data types of the table’s column bindings to match the data type of the columns in the data set. Then, add aggregations to the table’s bindings and bind the aggregations to data items. For example, add an aggregation to display the number of records in a group.
Column bindings must exist for every data item in the table. If the report does not require as many data items as the library table provides, set the column bindings on the table for the unused data items to empty strings.
How to use a library table having standardized data binding
1 Drag the table from a library in Resource Explorer into the report design.
2 Create a data source and data set.
3 Add a standard alias to each column in the data set.
4 Select the table. In Property Editor, select Binding. In Data Set, select the data set. To retain the data field bindings, in Change Data Set, choose No.
5 Choose Add Aggregation to define calculations for data items in footers.
6 Double-click each data item in the footers. In Column Binding, open Expression Builder and select an aggregation from the available column bindings. Choose OK in Expression Builder and in Column Binding.
7 Edit the labels to display suitable headers.
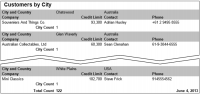
8 Make any other changes, such as grouping and filtering. Figure 28‑18 shows the grouped, four-column table element shown in Figure 28‑13, customized to display customer information.
Figure 28‑18 Customization of the library table to show customers by city
Figure 28‑19 Customers by City report using the customized library table
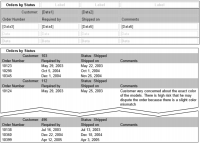
Figure 28‑20 shows the same table element customized to display order information and the report produced by this table.
Figure 28‑20 Customization of the library table to show orders by status
Using styles from a library
A report design supports use of a theme from a library to display report items using a complete set of predefined styles. A report design can use styles from a theme, from a CSS file, and from the report design itself. If any of these styles have the same names, BIRT uses the following rules to determine which style to use:
If the report design defines a style, that style takes precedence over a style in a CSS file or a theme.
A style from a CSS file takes precedence over a style in a theme.
A style in a theme is used when there is no style defined in a CSS file or the report design itself.
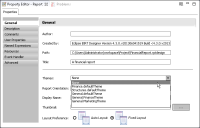
To assign a theme to a report design, drag the theme from the library in Resource Explorer and drop it onto the report design. This action makes all the styles in that theme available to items in the report design. Any predefined styles in the theme, such as grid and table, take effect immediately on items in the design. Property Editor shows the theme that the report design is using, as shown in Figure 28‑21.
Figure 28‑21 Properties for a report design that uses a theme
To revert a report design to use no theme, set the Themes property of the report design to None. After setting this property, the Outline view no longer shows a Themes item.
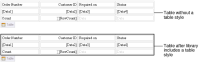
Because a library is dynamic, when a library developer adds styles to a theme, they become available to all report designs that use that theme. For example, consider a theme that does not have a style called table. Tables in a report design that uses this theme appear in the default style. Later, a library developer adds a style called table to the theme. Now the appearance of the tables in that design match the style defined in the theme. Figure 28‑22 demonstrates the change in appearance of a table after a library developer adds a table style having a border to the theme in the library.
Figure 28‑22 Effect of new library styles on a report element
How to set a theme for a report design
1 In Resource Explorer, expand the library that contains the theme. Expand the Themes node in the library.
2 In the layout editor, click a blank area of the report. Then, drag a theme from Resource Explorer and drop it in the layout editor. Any predefined styles in the theme take effect in the report design immediately. The appearance of any report items in the layout editor changes to match the styles in the theme. The library appears in the Libraries node of the Outline view.
How to drop a theme from a report design
To drop a theme, change the Theme property of the report root item.
1 In the Outline view, select the report root item, as shown in Figure 28‑23. The report design’s properties appear in Property Editor.
Figure 28‑23 Report root item selected
2 In Property Editor, select None from the list in Themes, as shown in Figure 28‑24.
Figure 28‑24 Dropping a theme in Property Editor
Now, the theme that the report design uses is None, which means that it uses only its own styles or styles from an included CSS file, not styles from a theme in a library.