You can write scripts in JavaScript that specify the task to perform when a particular event occurs. This type of script is called an event handler. Like BIRT and HTML5 charts, maps support two types of event handlers:
Event handlers that respond to user interactions, such as a mouse click on a location when viewing the map. For example, you can create an event handler to link to a report when a user selects a location in a map.
Event handlers that occur before BIRT renders the map. Use this type of event handler to conditionally change map elements before the map is generated. For example, you can add markers and connection lines to cities where you have offices.
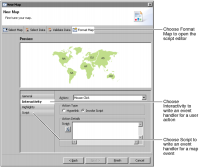
For both types of event handlers, you use the script editor in the chart builder, as shown in Figure 18‑10. To launch the script editor, choose the Format Map tab.
Figure 18‑10 Script editor displaying the UI for writing a user action handler
To create an event handler that responds to a user interaction, choose Interactivity. To create an event handler that responds to a chart event, choose Script, as shown in Figure 18‑10.
Writing event handlers that respond to user interactions
Depending on what you want to accomplish, you can create some of these interactivity event handlers without scripting. For typical event handlers, the script editor in the map builder simplifies the process by providing a list of actions. Choose an action, such as Show Tooltip or Mouse Click. Selecting Mouse Click enables the action types Hyperlink or Invoke Script. Select Hyperlink to link to a URI, internal bookmark or drill-through report. To implement a custom action, choose Invoke Script, then write JavaScript code. For maps, this code can use the Fusion Charts Map API.
Adding tooltips to a map
Tooltips display values when the user places the mouse pointer over a map location. This can display additional information about a location such as its full name and the value displayed in the location.
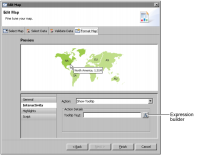
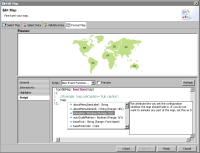
Figure 18‑11 shows an example of an event handler that manages the Show Tooltip action. In this example, the tooltip is set to display the data value, which is typical. You can change the Tooltip Text to create your own tooltip values using the expression builder.
Figure 18‑11 Script editor displaying the tooltip event handler
Adding hyperlinks to a map
You can create hyperlinks to external content such as a document or web page, to a different section in the same report, and to a section in a different report. For example, you can create a hyperlink that opens a new map of country locations when a user selects a continent.
Choose Edit base URL to access all hyperlink options. These options are the same as hyperlink options for charts. For more information about adding hyperlinks to BIRT report items, see Defining a hyperlink.
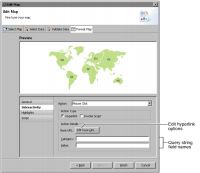
Figure 18‑12 shows an example of a mouse click event handler that creates hyperlinks for locations on the map.
Figure 18‑12 Adding hyperlinks to map locations
You can also add query string fields to any URL created by the mouse click action. This enables you to create custom URLs for each location on the map. When you type a field name for the category and value of the selected location a query string using the selected name and value are appended to the base URL. The base URL is defined in Edit base URL.
For example, if you type location in Category and you type sold in Value, then any URL that is generated from the mouse click event includes location and sold in the URL as a query string in the following format:
?location=<category>&sold=<value>
When the user selects a location, <category> is replaced with the name of the location and <value> is replaced with the value of the location. If the user selects the North American continent which is displaying 10,000 units sold, the following query string is generated and appended to the base URL:
?location=NA&sold=10000
If the base URL is http://webserver.com/ then the URL created for the user selection in this example is:
http://webserver.com/?location=NA&sold=10000
If you need to create more complex URLs, such as to open another BIRT document or file, you can leave the query string names empty and choose Edit base URL for additional hyperlink options.
Adding interactive script to a map
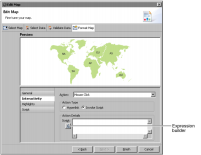
You can add your own JavaScript that runs at the selected map action. Figure 18‑13 shows an example of an event handler that adds interactive script to locations on the map. You can add JavaScript that starts when a user selects a location on the map.
Figure 18‑13 Adding interactive script to the mouse click action
Using event handlers before map generation
Unlike event handlers that respond to user interactions with the map, the event handlers that you write require programming in JavaScript. You also have to learn the Fusion Charts API to know what map options you can manipulate and how.
In the script editor, you select a map function, such as handleMap( ) or handleData( ), then you write code that performs a specific task or tasks before the map is rendered. These event handlers execute on the client-side.
Write client-side scripts using the script editor accessible from the Format Map tab in the map builder. Write server-side scripts using the script editor accessible from the Script tab in the report editor. Only the following server-side event functions are supported for maps: onPrepare( ), onCreate( ), onRender(), and onPageBreak( )
This section provides information about writing client-side event handlers for map events. For information about writing server-side event handlers, see Integrating and Extending BIRT.
For documentation about the Fusion Charts API, go to the following location:
Table 18‑3 lists the map functions available before the map is rendered.
Table 18‑3 Map event functions
Map functions
Description
handleMap(map)
Called to change map formats
handleData(data)
Called to change data
handleMarkers(markers)
Called to add markers or pins
handleColorRange(colorrange)
Called to add color ranges
handleEntityDef(entitydef)
Called to change entity definitions
Setting map options through scripting
The map event functions are called after BIRT generates the static JavaScript options, which are based on the map’s data and formatting options set in the map builder. Use the map event functions to add map options that Fusion Charts provides, but that are not available through the map builder’s format page, such as adding custom markers or changing the name of location entities.
For example, Fusion Charts provides an option to change the background of a legend on a map. To remove the legend’s background color set the transparency value to zero using the following code:
handleMap: function(map)
{
map.legendBgAlpha = 0;
},
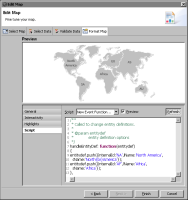
As the code example shows, handleMap( ) receives a map object. You use this map object to configure map options. When you type the word, map, followed by a period (.), the script editor displays a list of options, as shown in Figure 18‑14. Click an option to view summary information about it. Double-click an option to add it to your code.
Figure 18‑14 The script editor displaying the available options
How to preview formatting changes on a map
You can preview your formatting changes in Format Map. This example uses a world map and changes the location entity names displayed in the map.
1 In Format Map, choose Script to add scripts to the map.
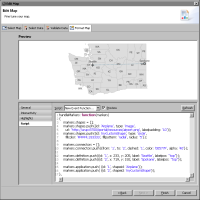
2 In Script, choose handleEntityDef, as shown in Figure 18‑15.
5 Select Preview and choosing Refresh in the Format Map tab, as shown in Figure 18‑16. The new labels appear in the map preview.
Figure 18‑16 Previewing the map after adding scripts
6 Choose Finish to save the map or Cancel to delete it.
Using map markers and connection lines
You can create your own custom defined markers on a map using scripts. Custom markers include changing the color and size of a default marker like a circle or triangle. Custom markers can also display images. After defining the shape of the map marker, you can define the x-axis and y-axis location of the marker on the map and give it a label. Any two markers can also display a connection line between the markers.
The following script enables custom markers, assigns each one a different shape, and draws a connector line between the two markers:
markers.connectors.push({from: '1', to: '2', dashed: '1', color: '00577F', alpha: '40'});
}
Using images for a custom marker requires a URL address to the image location. Use an absolute path URL for the marker image enables PDF exports of the map to include the marker image. Using an absolute path URL also enables the marker image to display in the BIRT Designer Professional map preview. Using a relative path URL enables deployment of the marker image inside a BIRT application but limits preview and export options.
Figure 18‑17 shows an example of using script to add custom markers to a map. This example uses an absolute path URL to display the custom marker image. In this example http://urup:8700/iportal/resources/airport.png is the URL address to an image file that is copied directly to the a folder in Information Console. This image is not in a volume.
Figure 18‑17 Adding custom markers to a map
If your map is part of a BIRT application you can save the image inside the same application folder and use a relative URL to the image. In this case you can only preview the image when viewing the map as a BIRT application, either in BIRT Designer Professional or in Information Console.
For example, you have an airport.png image file that you want to display as a marker on a map. The image is in an images folder inside the application. Using the BIRT application URL conventions, the relative URL path to the image is:
apps/MapMarkers/images/airport.png
The following script loads an image as a custom map marker using a relative URL: