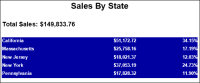
Reports typically display both detail and aggregate data. A summary report is a report that shows only aggregate data. Summary reports, such as the top 10 products or sales totals by state, provide key information at a glance and are easy to create. Figure 10‑20 shows an example of a report that displays sales data by state. This report is the summary version of the report shown in Figure 10‑14.
Figure 10‑20 Summary report showing sales data by state
Hiding details
When creating a report that contains data in detail rows and aggregate data in header or footer rows, you can change such a report to a summary report by hiding the contents in the detail rows. To hide these contents, use one of the following techniques:
Choose the group that contains the details to hide, and in the group editor, select the Hide Detail option.
Select the row that contains the details, and use the Visibility property to hide the contents of the row.
While both techniques provide the flexibility of maintaining two versions of a report, the first technique is more intuitive. In a report that contains more than one group, however, using the Visibility property gives you more control over which group details to hide.
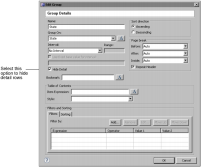
Consider the example sales report that groups order data by state and product. To show only the state totals, as shown in Figure 10‑20, you choose the top-level group, state, then select the Hide Detail option, as shown in Figure 10‑21.
Figure 10‑21 Select Hide Detail to hide all data within the state group
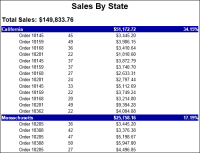
Hiding the details from the state group recursively hides all data within the state group; the report hides product groups and the order details within each product group. You may want to hide only the product groups, but still show the order details within the product groups, however, as shown in Figure 10‑22. You can get this output only by selecting specific sections and using the Visibility property to hide the selected sections.
Figure 10‑22 Report showing the top-level state data and the order details, but not the product groups
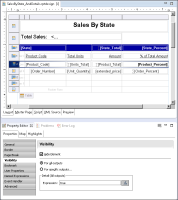
Figure 10‑23 shows the report design that generates the output in Figure 10‑22. In the design, the following rows have their Visibility property set to hide the rows:
Group 1 header row, which displays the column headings for the product summary data
Group 2 header row, which displays the product summary data
Figure 10‑23 Report design with the product group row selected, and the row’s Visibility property set to hide the row
Figure 10‑23 shows the group 2 header row selected in the layout editor, and the Hide Element option selected for the Visibility property in Property Editor.
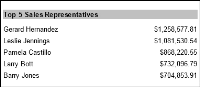
Creating a top n report
To create a top n or bottom n summary report, insert the aggregate data in the header or footer row. Then create a filter for the group that contains the data, and use a filter condition, as shown in the following examples:
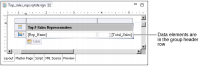
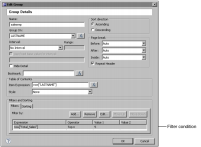
The data elements that display the sales representative names and their sales totals are in a group header row. This report groups sales data rows (not shown in the report) by sales representatives. To display only the top five sales representatives, a filter is specified in the group definition, as shown in Figure 10‑26.
Figure 10‑26 Defining a top five filter in the group