To create a cross tab, you need access to a BIRT data object containing a cube or data model in the volume. When you populate a cross tab in Interactive Crosstabs, the default view available is the grid or tabular view. You can switch to chart view to display the same data graphically in a chart. The default chart type is a column chart. You can change this to a chart type more suited for the data in your cross tab as described in later sections of this document.
When you create a cross tab, you choose the dimension, attribute, and measure fields to display. For dimension fields containing date‑and‑time data, you also specify a grouping interval. For measure fields, you specify a function based on which the aggregate value in each detail cell is calculated. You can also specify whether to display subtotals or grand totals, or both, and the location.
How to create a cross tab using Interactive Crosstabs
1 In the volume, in the navigation pane, select the Resources folder. Select a BIRT data object store (.data) file containing a cube or data model to use for the cross tab. The example in this procedure uses the sample data object store file, Classic Models.data.
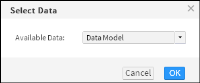
2 Select Data appears. In Available Data, select a cube or data model from the list. Figure 10‑39 shows the selection of Data Model.
Figure 10‑39 Selecting a cube or data model
Choose OK.
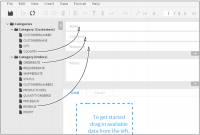
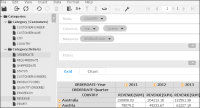
The BIRT data object store file containing the selected data model appears in Interactive Crosstabs, as shown in Figure 10‑40. The data pane displays the available dimension, attribute, and measure fields available for use in the cross tab. The structure pane displays blank fields and the placeholder for a grid.
Figure 10‑40 Viewing the selected data model in Interactive Crosstabs
3 To create the cross tab, complete the following steps:
1 Drag the COUNTRY field from the data pane, and drop it in Rows, in the structure pane, as shown in Figure 10‑40.
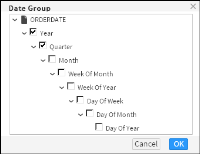
2 Drag the ORDERDATE field and drop it in Columns. Date Group appears, as shown in Figure 10‑41, displaying the available time intervals for grouping the Order date field. Select Year and Quarter to group display data values grouped by year and by quarter. Columns displays the group labels Year and Quarter.
Figure 10‑41 Specifying grouping intervals
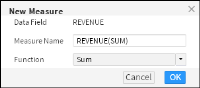
3 Drag the REVENUE field and drop it in Measures. New Measure appears, as shown in Figure 10‑42. Measure Name displays the measure field and the aggregate function assigned to it in the cube or data model. In Function, select a different aggregate function, if necessary. This example uses the default SUM function.
Figure 10‑42 Specifying an aggregate function
Choose OK. As you drag and drop data fields in the Rows, Columns, and Measures areas, the cross tab grid in the structure pane displays aggregate data in the cross tab, as shown in Figure 10‑43.
Figure 10‑43 Viewing the cross tab grid view in the structure pane
4 Now that you have populated your cross tab, specify whether to display grand totals, subtotals, or both, and the location. The following example displays grand totals for the row and column fields. Complete the following steps:
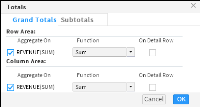
1 On the main toolbar, select Totals. Totals—Grand Totals appears. Complete the following steps:
In the available measures in Row Area and Column Area, in Aggregate On, select the measures for which to display grand totals.
For each selected measure, in Function, select a function from the list to calculate the grand total, as shown in Figure 10‑44.
Specify one of the following:
Deselect On Detail Row to enable Interactive Crosstabs to use the cross tab display values to calculate grand totals.
Select On Detail Row to enable Interactive Crosstabs to use the detail row values in the cube or data model to calculate grand totals.
Figure 10‑44 Displaying grand totals for rows and columns
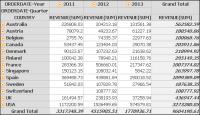
2 Choose OK. The resulting cross tab resembles the one shown in Figure 10‑45.
Figure 10‑45 Viewing a cross tab displaying grand totals for rows and columns
5 You can use the '+' symbols next to the Country names and the Orderdate-Year values to drill down into details for each field. Drilling down into each Year field displays aggregate data for each quarter in the year. Drilling down into each Quarter displays aggregate data for each month in the quarter, and so on. When you drill down further into each quarter, the Month interval appears in the Columns area.
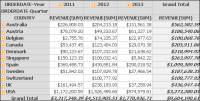
6 To format the values in the cross tab as currency in US dollars ($), complete the following steps:
To format the detail rows as currency, select and right‑click a detail cell in the cross tab. Choose Format➛Format Data.
To format values in the grand total row, right‑click a cell in the bottom row of the cross tab and repeat the steps to apply a currency format.
To format values in the grand total column, right‑click a cell in the rightmost column of the cross tab and repeat the steps to apply a currency format.
To format the grand total value for all rows and all columns, right‑click the grand total cell in the bottom right corner of the cross tab and repeat the steps to apply a currency format.
The cross tab resembles the one shown in Figure 10‑46.
Figure 10‑46 Examining a cross tab with data formatted as currency in US dollars
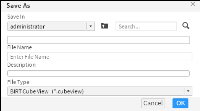
7 Finally, to save the cross tab you just created, choose Save. Complete the following steps:
In Save As, in Save in, navigate to a folder in the volume.
In File Name, type a name for the cross tab.
In Description, optionally provide a description for the cross tab.
In File Type, select a file type from the list. Figure 10‑47 shows the selection of the BIRT cube view (.cubeview) file type.
Figure 10‑47 Saving a cross tab as a BIRT cube view file
Choose OK. Interactive Crosstabs saves the cross tab using the file name you provided, in the specified location.