The cross tab in Figure 5‑6 displays sales data by product line and state.
You can display totals for each dimension that you add to a cross tab and for each level within a multilevel dimension. The rows and columns that display the subtotals and grand totals are highlighted in the cross tab. In the example cross tab you just created, no subtotals appear. Subtotals are displayed when you set a multidimensional data field, as a row or column.
Each number displayed in a cross tab represents an aggregate total. Grand totals display the total sales of all products for each state, the total sales of each product, or the total of all sales across products and states. Subtotals display the sales of each product in each state, and so on. You specify the aggregate totals that appear in a cross tab.
How to display aggregate values in a cross tab
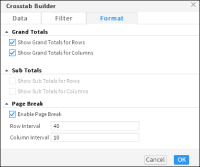
1 To specify display properties for the aggregate values in the cross tab, in Crosstab Builder, choose Crosstab Builder—Format, as shown in Figure 5‑7.
Figure 5‑7 Specifying display options for the aggregate values
2 In Grand Totals, do the following:
Select Show Grand Totals for Rows to display grand totals for each row.
Select Show Grand Totals for Columns to display grand totals for each column.
3 You can display subtotals for multilevel dimensions used in rows or columns. Because the example in Figure 5‑7 does not contain multilevel dimensions, the Sub Totals section is not highlighted. In Sub Totals, if highlighted, do the following:
Select Show Sub Totals for Rows.
Select Show Sub Totals for Columns.
4 In Page Break, as shown in Figure 5‑7, select Enable Page Break to specify pagination properties for the cross tab, and do the following:
In Row Interval, type a value, such as 40.
In Column Interval, type a value, such as 10.
Choose OK. Sample data appears in the cross tab, displaying grand totals for rows and columns, as shown in Figure 5‑8.
Figure 5‑8 Displaying grand totals for rows and columns in a cross tab