A funnel shows simplified data in graphic form using several, stacked slices. Each slice represents a group of data. A slice that you select on the funnel separates from the rest of the funnel to highlight the visualization. The following tabs appear in Definition:
Measure: Use the buttons to add or delete measures and formulas. To edit an existing measure, double-click it.
Values: Provide the data to use in the segmentation and measure.
Properties: Select whether to display values or percentages.
How to add measures to a new funnel
1 In Gallery—Funnel, choose Definition.
2 Choose New measure.
3 Type a name for the new measure.
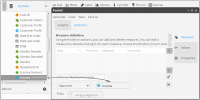
4 Select a function for the funnel. From Data Tree, drag a column on which to base the measure, as shown in Figure 5‑40.
Figure 5‑40 Defining a measure for a funnel
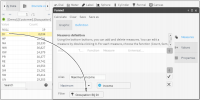
5 To create a filter, double‑click one of the columns in Data Tree. From Discrete Values, drag a field and drop it in Filter, as shown in Figure 5‑41.
Figure 5‑41 Adding a filter to a measure
6 To create the measure, choose the check mark.
How to add values and properties to a funnel
1 Choose Values.
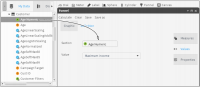
2 Drag a column from My Data and drop the column in Section, as shown in Figure 5‑42.
Figure 5‑42 Assigning a measure to a value that appears on a funnel
3 Select a measure on which to base a funnel.
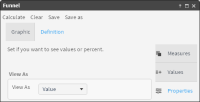
4 Choose Properties.
5 In View As, choose an option to represent the data. For example, Figure 5‑43 shows choosing to view data as values.
Figure 5‑43 Configuring properties for a funnel
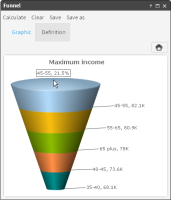
6 Choose Calculate. The funnel appears on Graphic. To see the values of a section, hover the cursor over the section, as shown in Figure 5‑44.
Figure 5‑44 Visualizing a data measure using a funnel