A label indicator displays the values of defined measures as text. Use labels to create comments to include in the canvas.
How to create a measure for a label
1 In Gallery—Label, choose Definition—Measures.
2 Choose New measure.
3 In Alias, type a measure name.
4 From the list of function names, select a function name.
5 From My Data, drag an item which the selected function will apply to and drop it next to the selected function name. For Count, drag a table. For all other functions, drag a column.
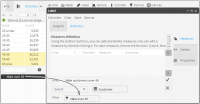
6 From Discrete Values or Scratchpad, drag a segment and drop it in Filter, as shown in Figure 5‑24.
Figure 5‑24 Adding a segment from Scratchpad as a filter for a label
7 Choose the check mark.
How to create a new, duplicate measure
1 Select an existing measure.
2 Choose Duplicate.
3 In Alias, type a unique name for the new measure.
4 Replace the function, column, or filter.
5 Choose the check mark.
How to define a label
1 In Label—Definition, choose Values.
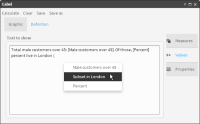
2 In Text to show, type text that provides context for the label.
3 Right-click, then select a measure. The selected measure appears at the cursor location. The example in Figure 5‑25 shows selecting a third measure for a text label.
Figure 5‑25 Selecting a measure for a label
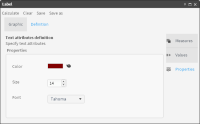
4 Choose Properties. Then, select color, size, and font properties for the label text, as shown in Figure 5‑26.
Figure 5‑26 Selecting text properties for a label
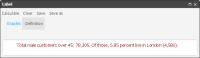
5 To create the label, choose Calculate. The label appears in Graphic, as shown in Figure 5‑27.